Getting Started
Welcome to Bluesonde. This guide will help you get acquainted with the Bluesonde Dashboard. In this guide, we'll go from creating an account to analyzing your data and sharing it with your team and others. Each step links to a detailed guide if you want to go deeper.
One note before you start. Several steps that we'll discuss require the Organization Admin role. If you are not an admin, your admin can handle those steps, and you will still be able to view everything they configure.
Throughout this guide you will meet a handful of core terms (Site, Deployment, etc). If you encounter a core concept that is unfamiliar, the Glossary defines them all in one place.
1. Create Your Account
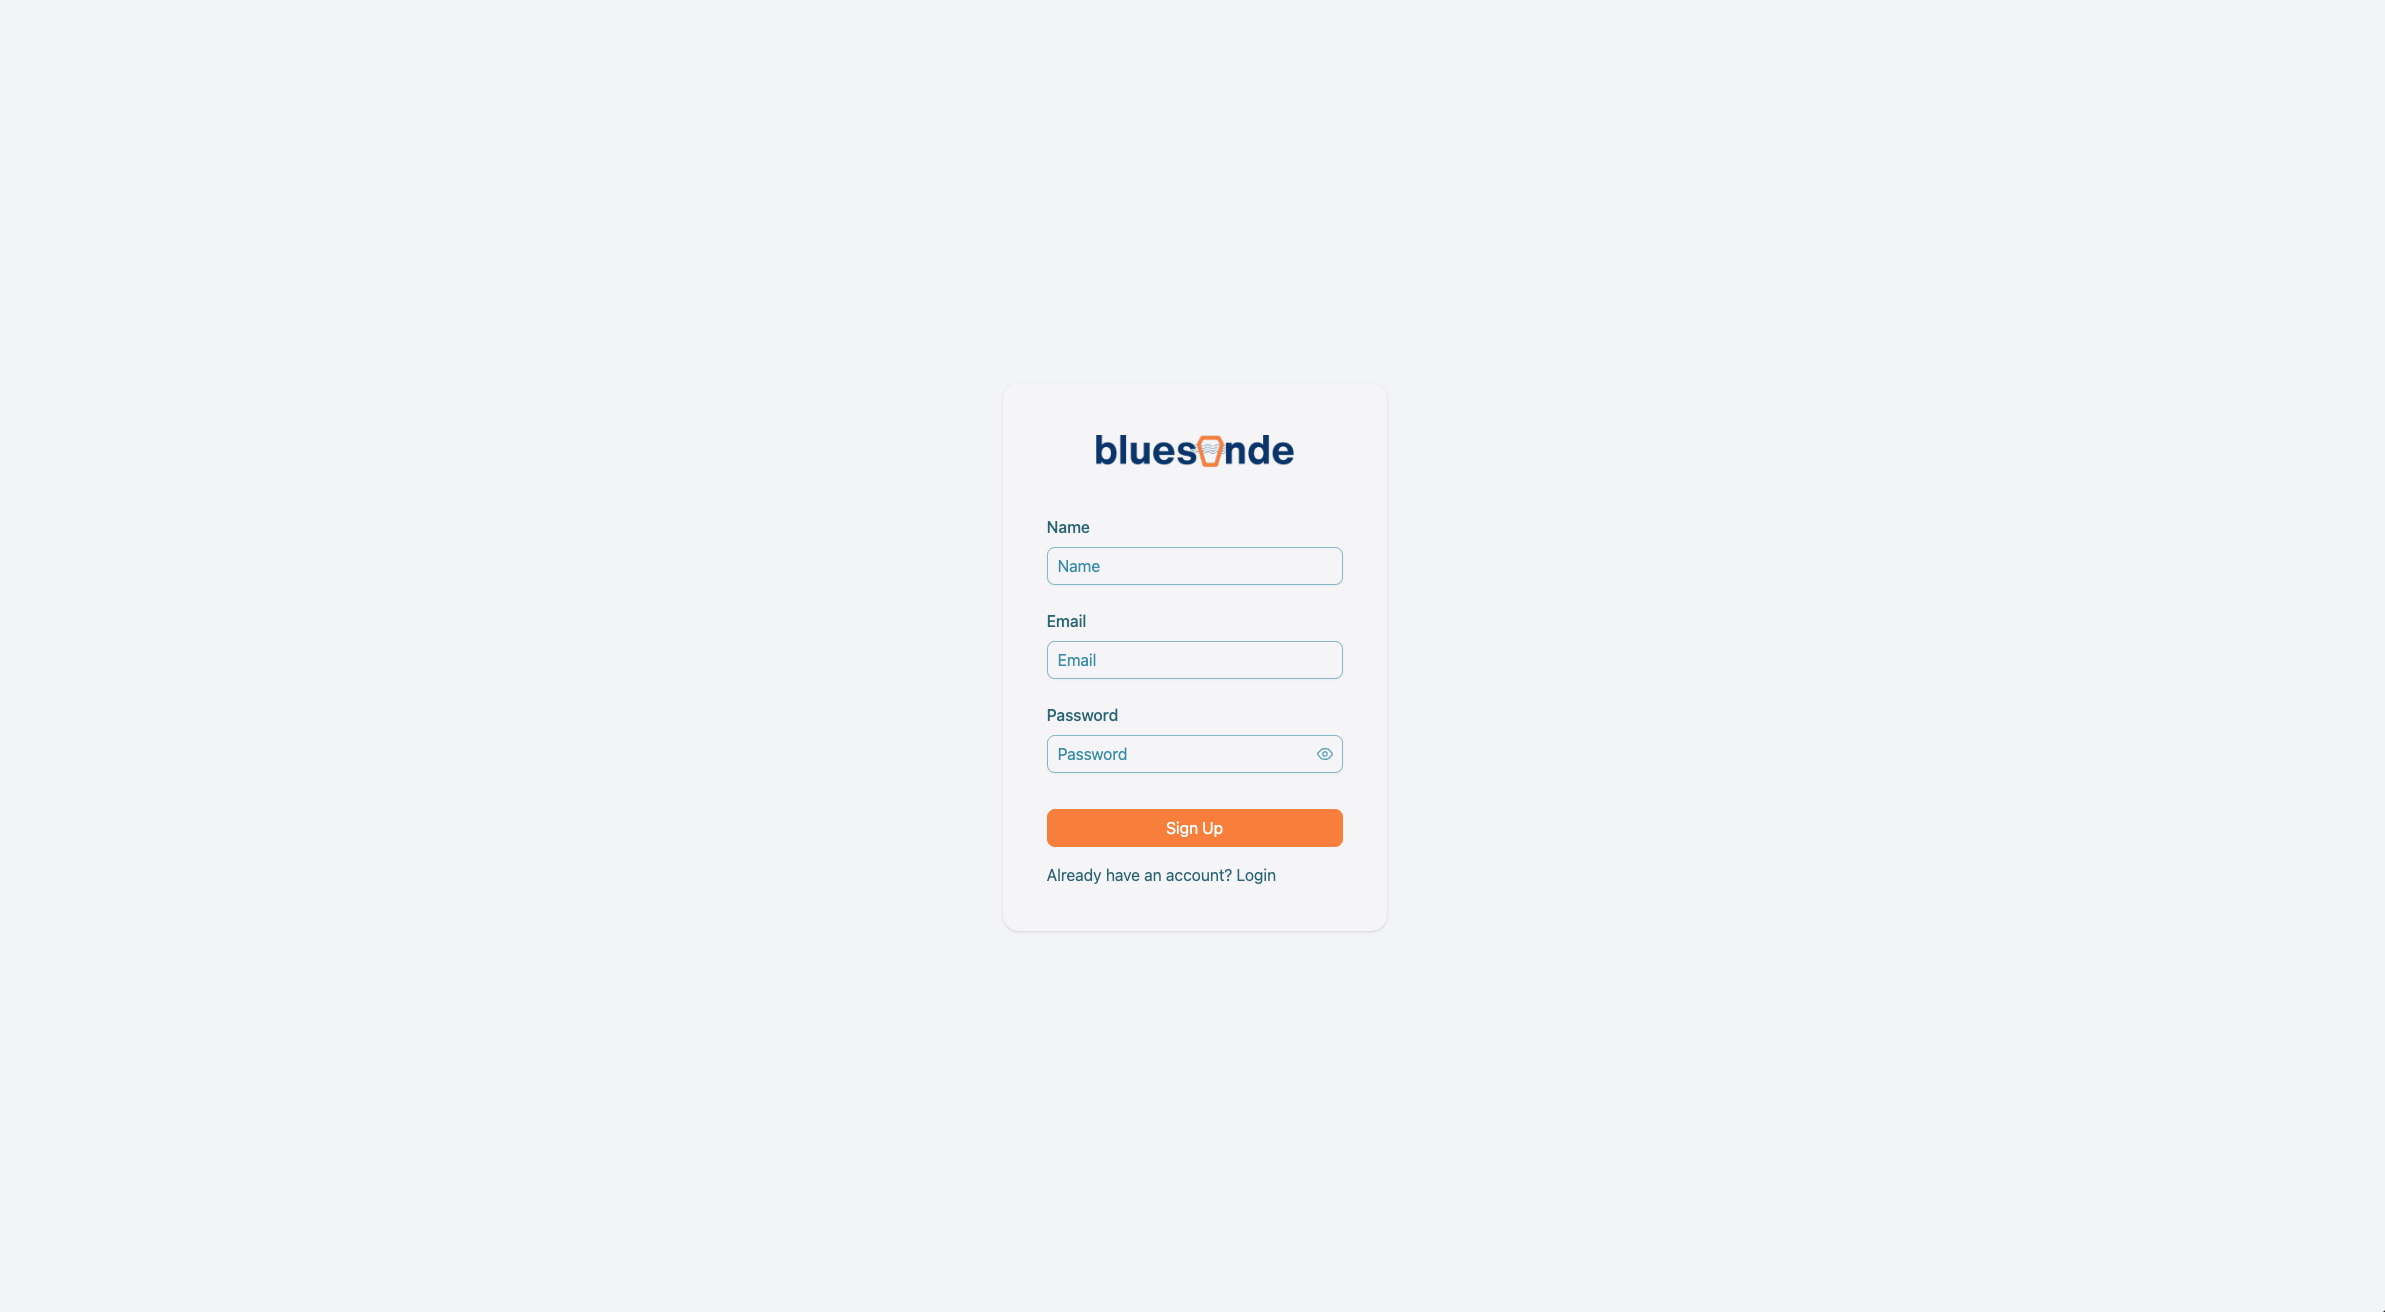
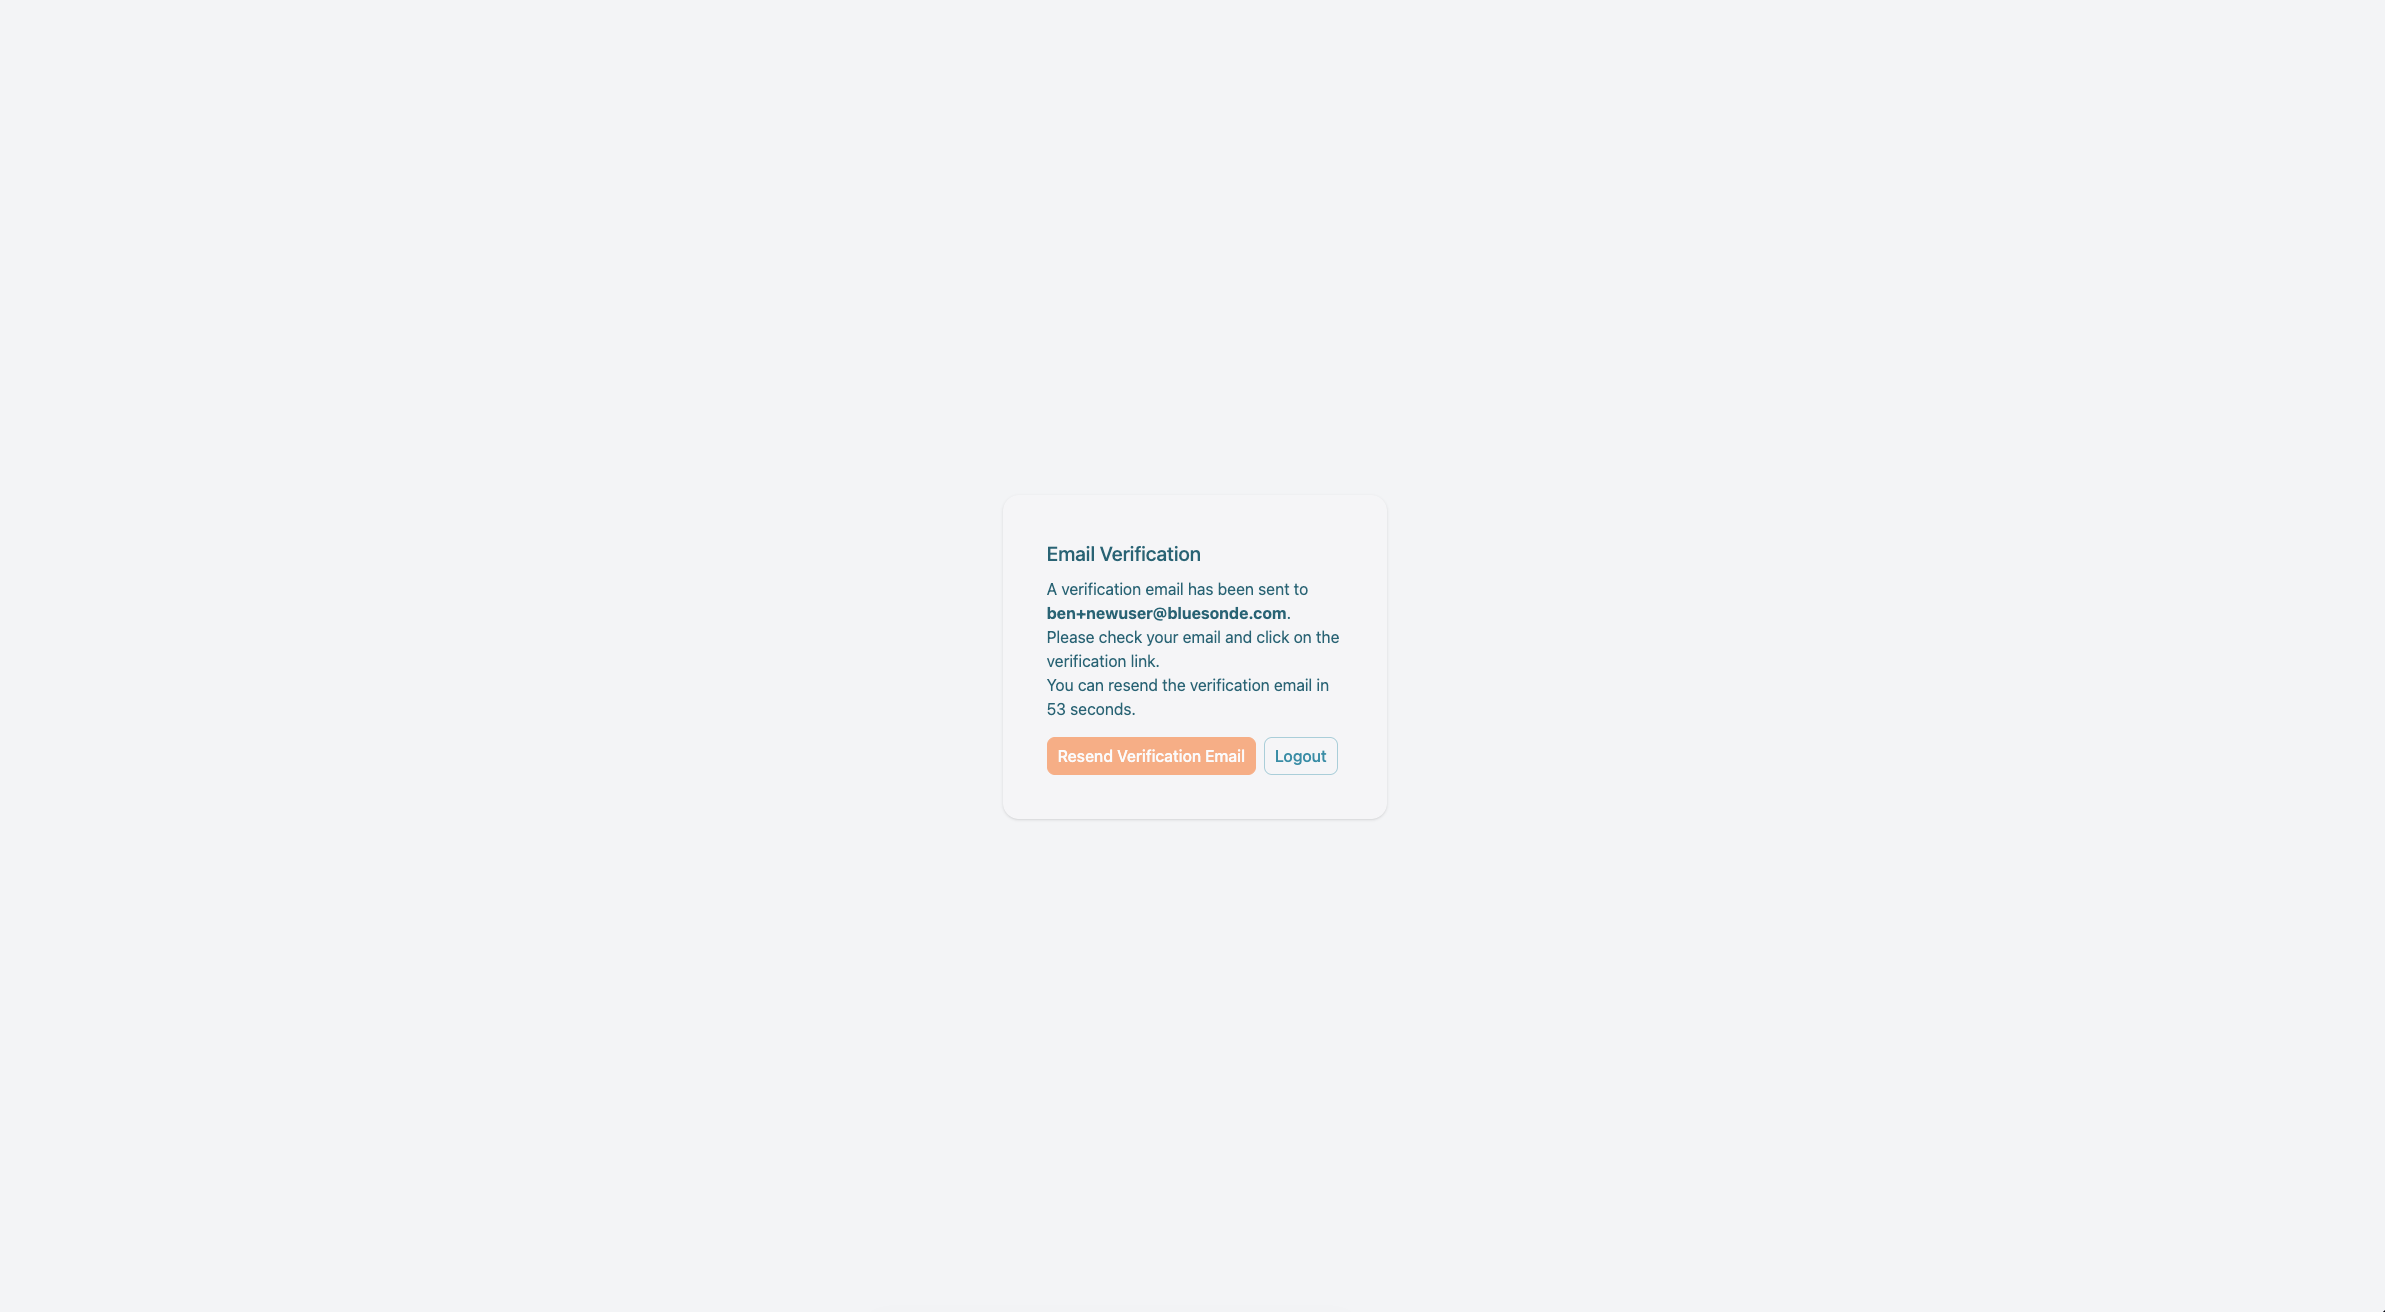
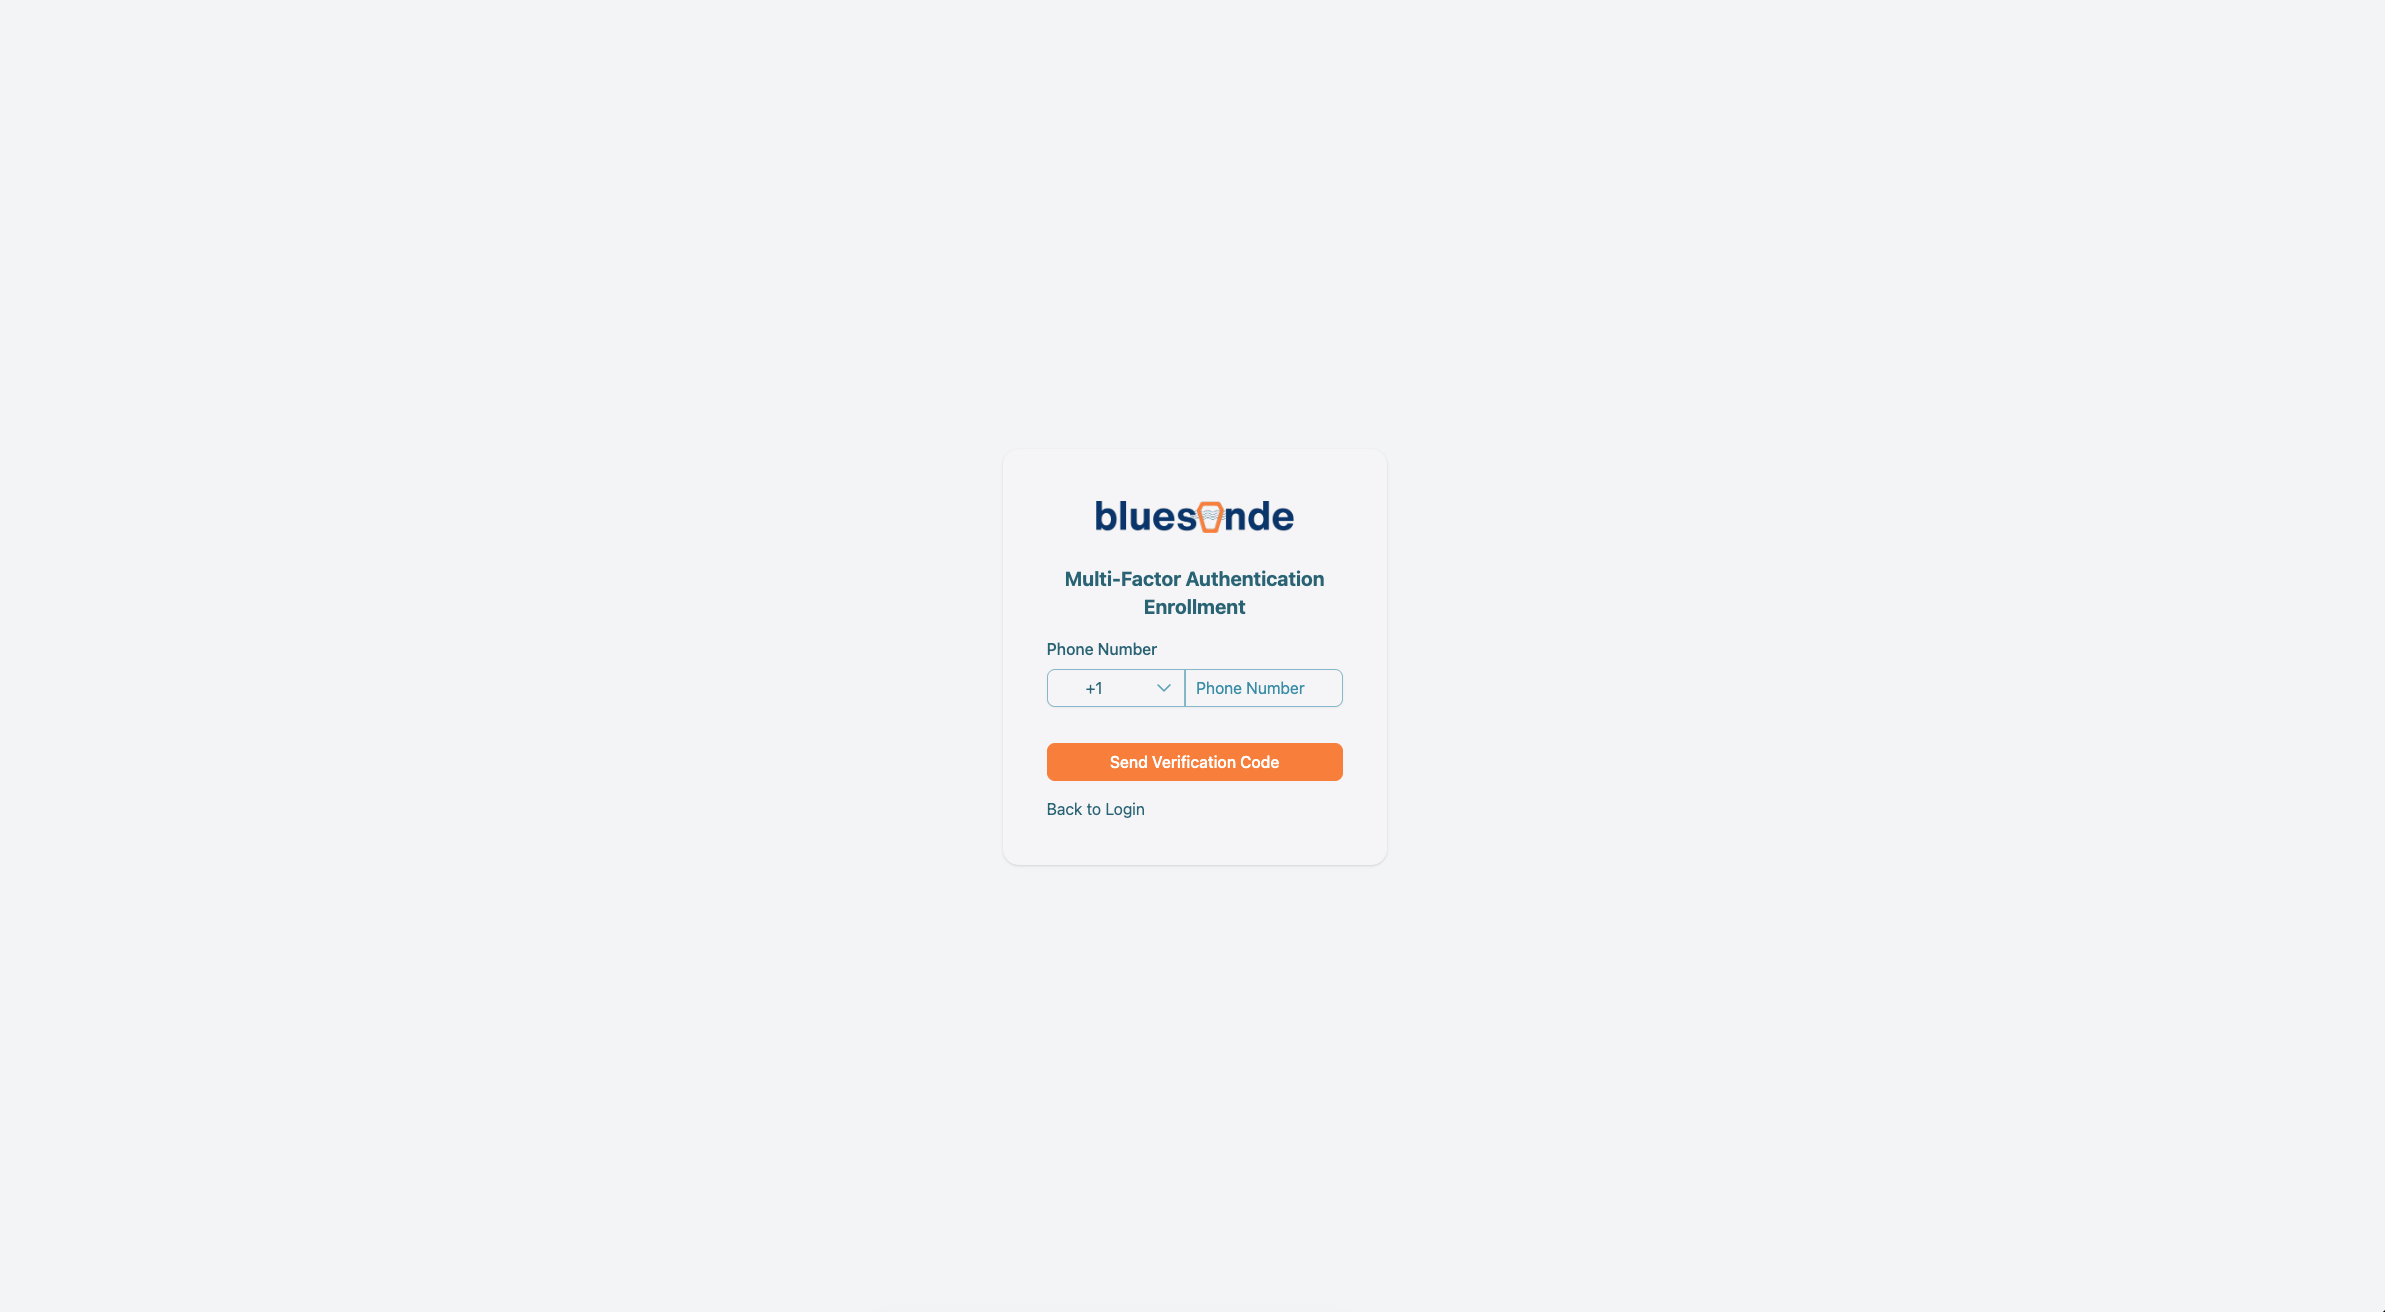
Everything in Bluesonde is tied to your account, so your first task is simply to get a secure login. Sign up with your name, email, and a strong password. Passwords must be at least 15 characters and include an uppercase letter, a lowercase letter, a number, and a special character. Confirm your email from the link we send (check spam if it doesn't come through), then enroll in phone-based multi-factor authentication (MFA), which Bluesonde requires. If you were sent an invitation link, use that link to sign up so you land in the right organization automatically.
2. Join Your Organization
An Organization is the workspace that owns your Devices and data. Bluesonde handles the creation of all organizations so, by default, brand new users are not members of any organization and will require a code to join one. If you signed up using an invitation link, you should already be a member of the inviting organization. Otherwise, paste your invite code on the Join screen, or ask your Organization Admin to send you a link.
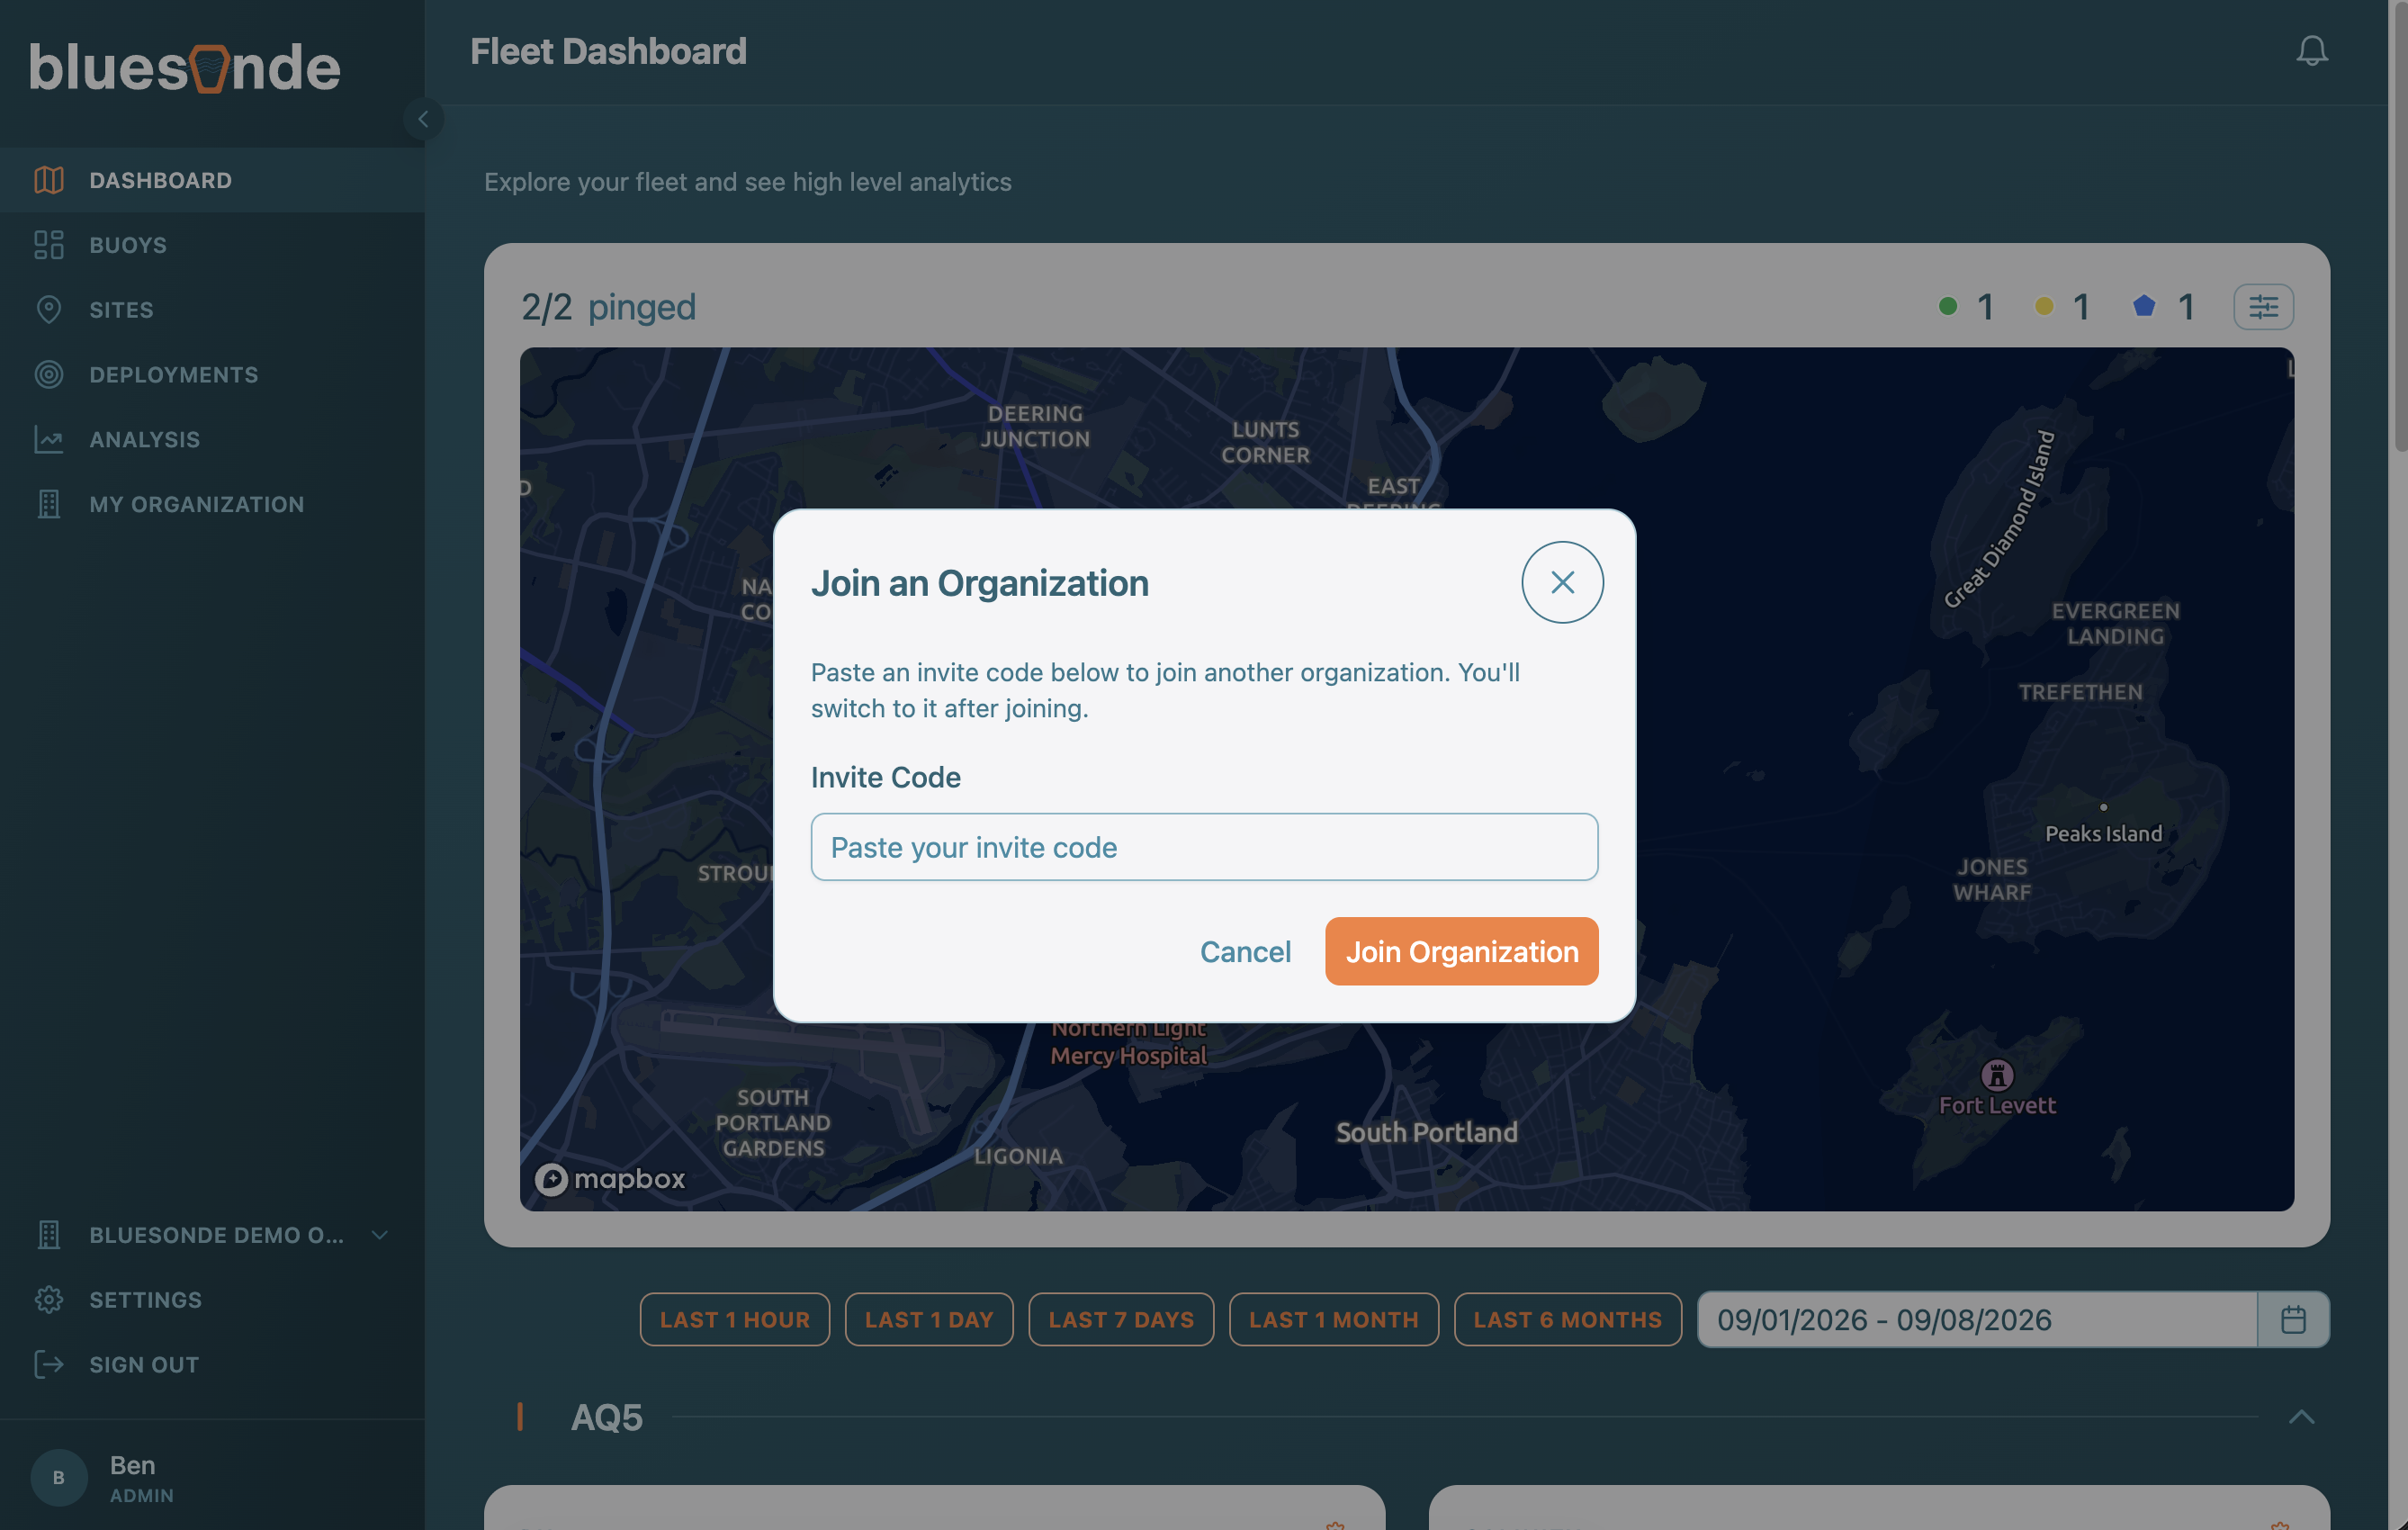
Once inside, the Dashboard opens on a live map of your fleet and time series data from every Device in it. If your Device has been turned on and is sending data, this is your confirmation that everything is connected: you should see your Devices on the map, each colored by its current status and live data below.
3. Set Your Preferences
Before you start digging into data, it's worth taking a moment to tell the Dashboard how you'd like it displayed. Open Settings from the gear icon at the bottom of the sidebar and find the Preferences section. Choose your Units (Metric or Imperial) so every reading, chart, and export shows up in the system you're used to, and decide whether to Hide diagnostics to keep internal sensor readings out of your Device views and charts. These preferences apply to your account only, so each teammate can set their own.
4. Inspect Your Device
The next step is to confirm your Devices are online and reporting.
If you are using a buoy for the first time, it will not report any data until it is switched on with a magnet. You will know if your buoy is in this state via its status icons. Follow the steps in your user guide to turn it on, then use the Devices page to check the Device's status and confirm it is online.
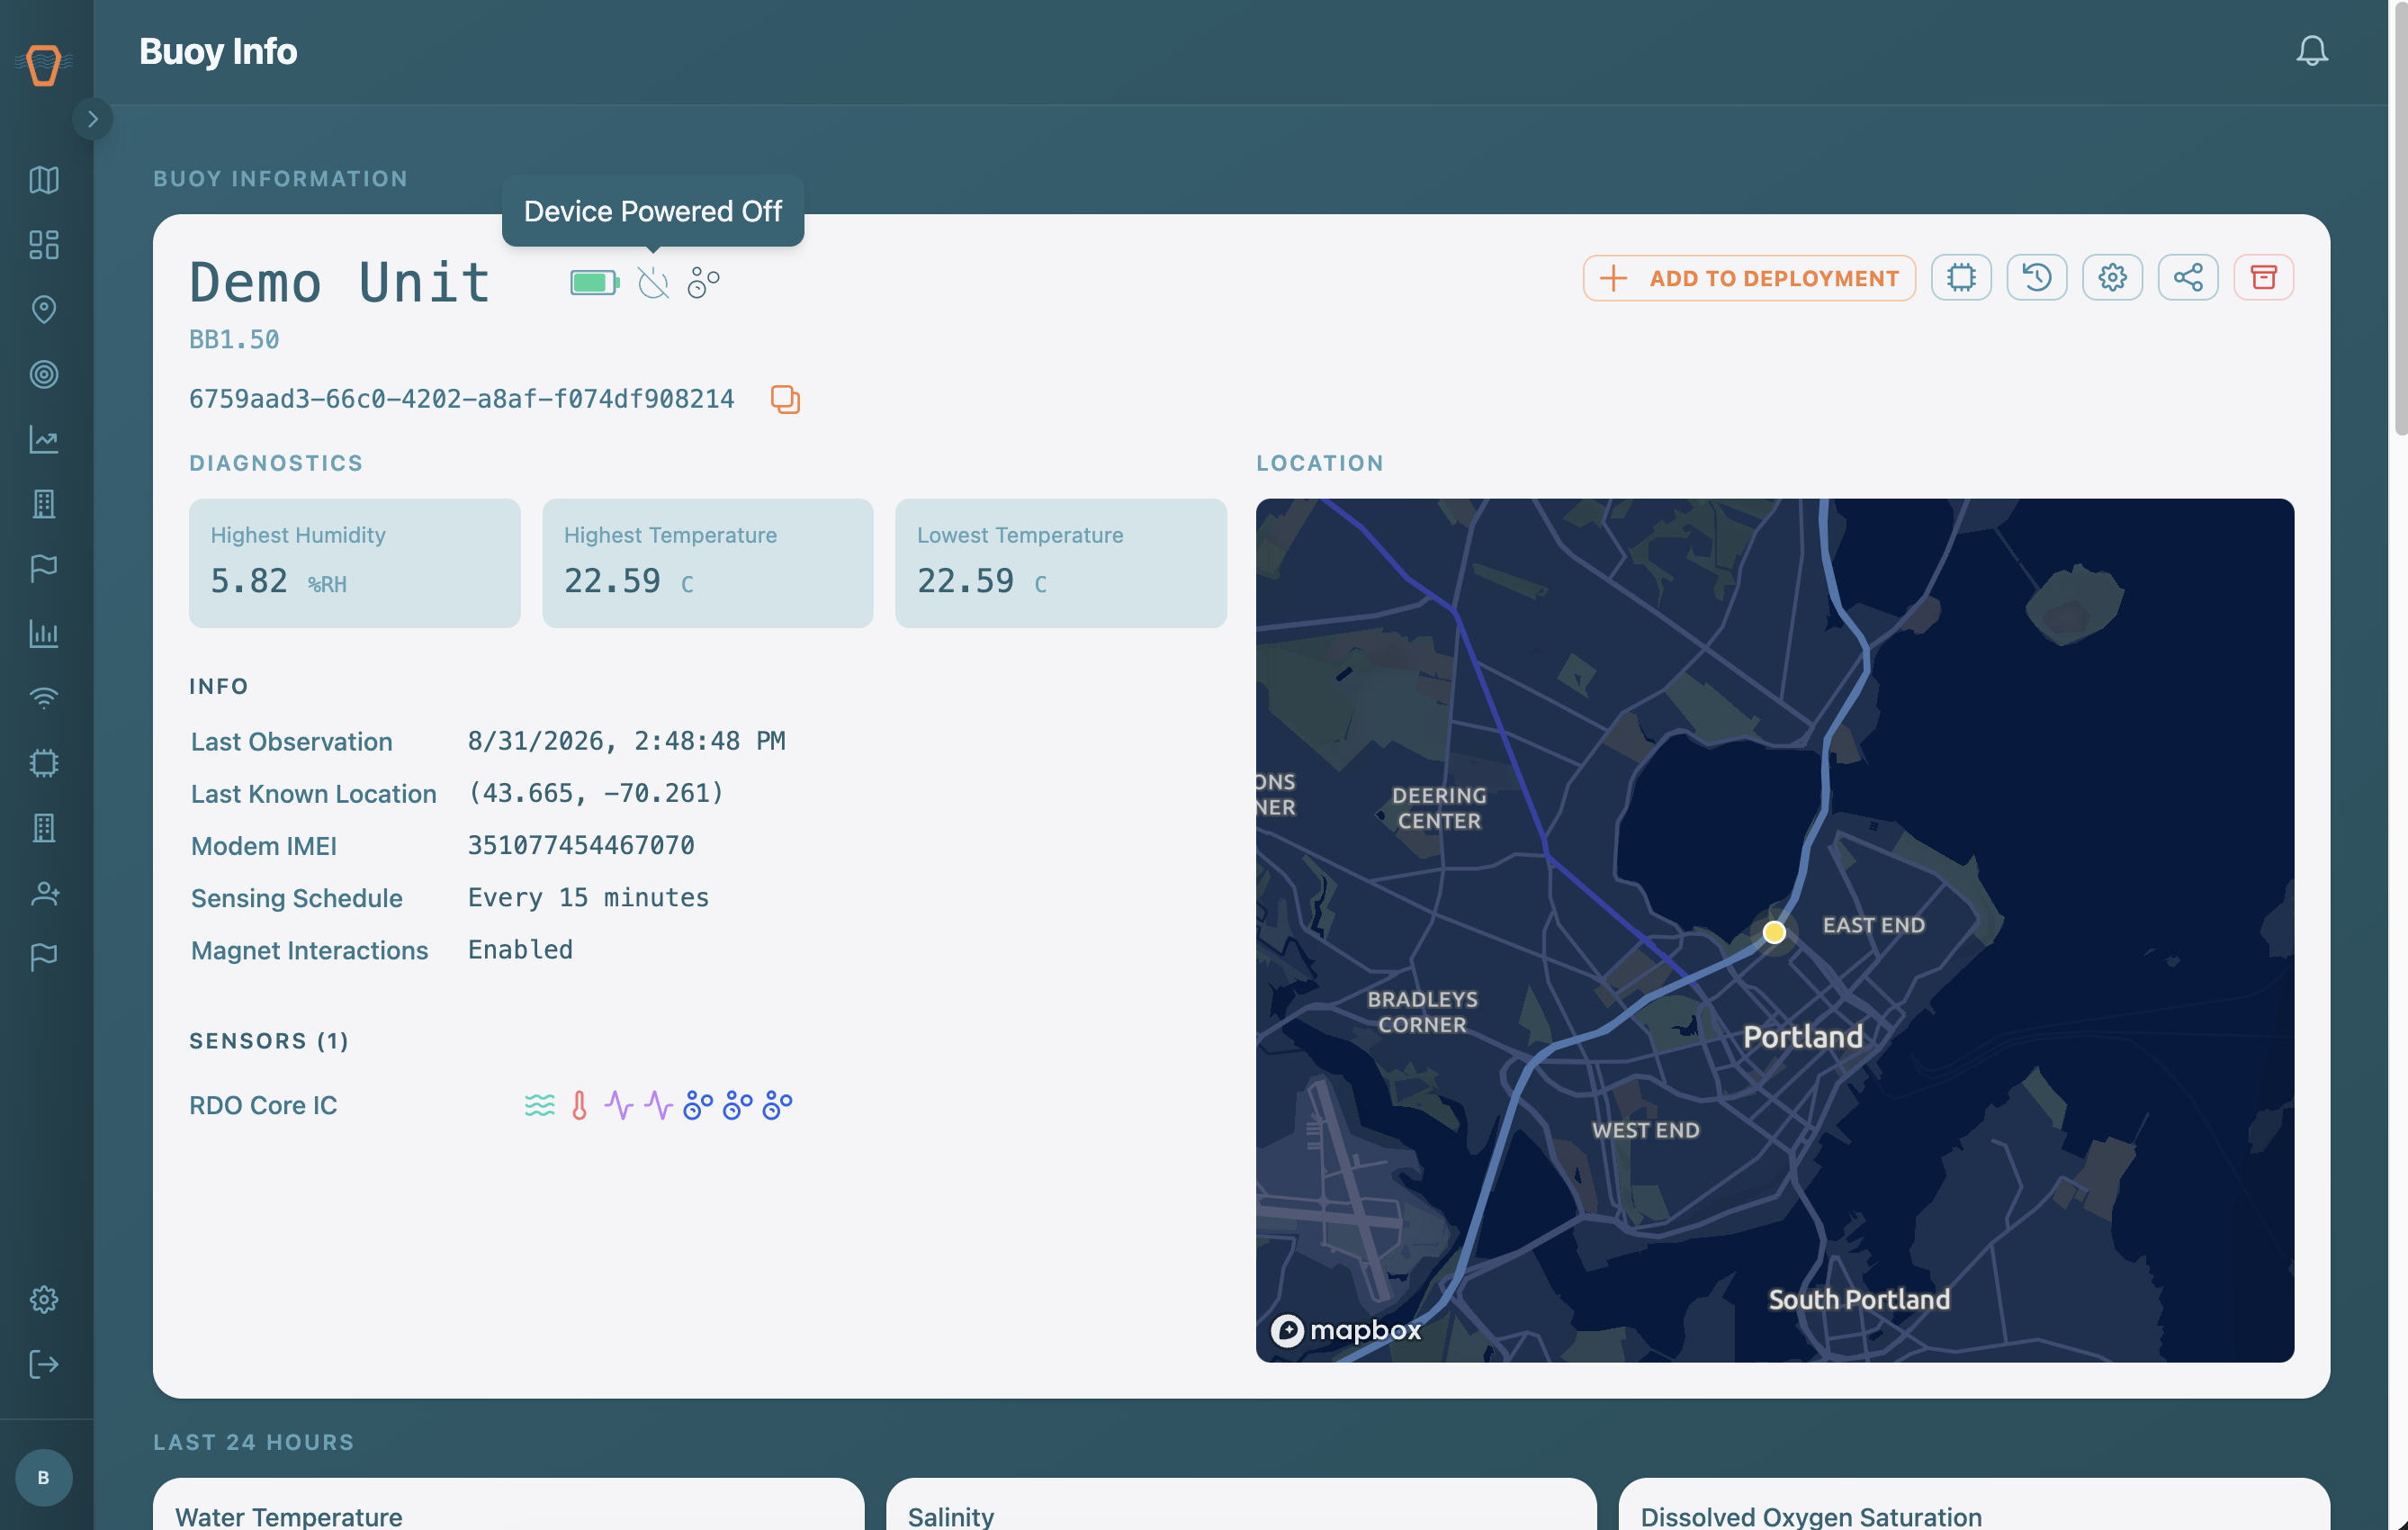
To get to the Device Info page, open a Device from the map or the Devices page, review its status, battery, Sensors, and last known location, and skim the 'Last 24 Hours' readings to confirm data is flowing.
If you are an Organization Admin, open the Device's Settings to view and update its sensing schedule. The schedule controls how often the Device wakes up and records Observations.
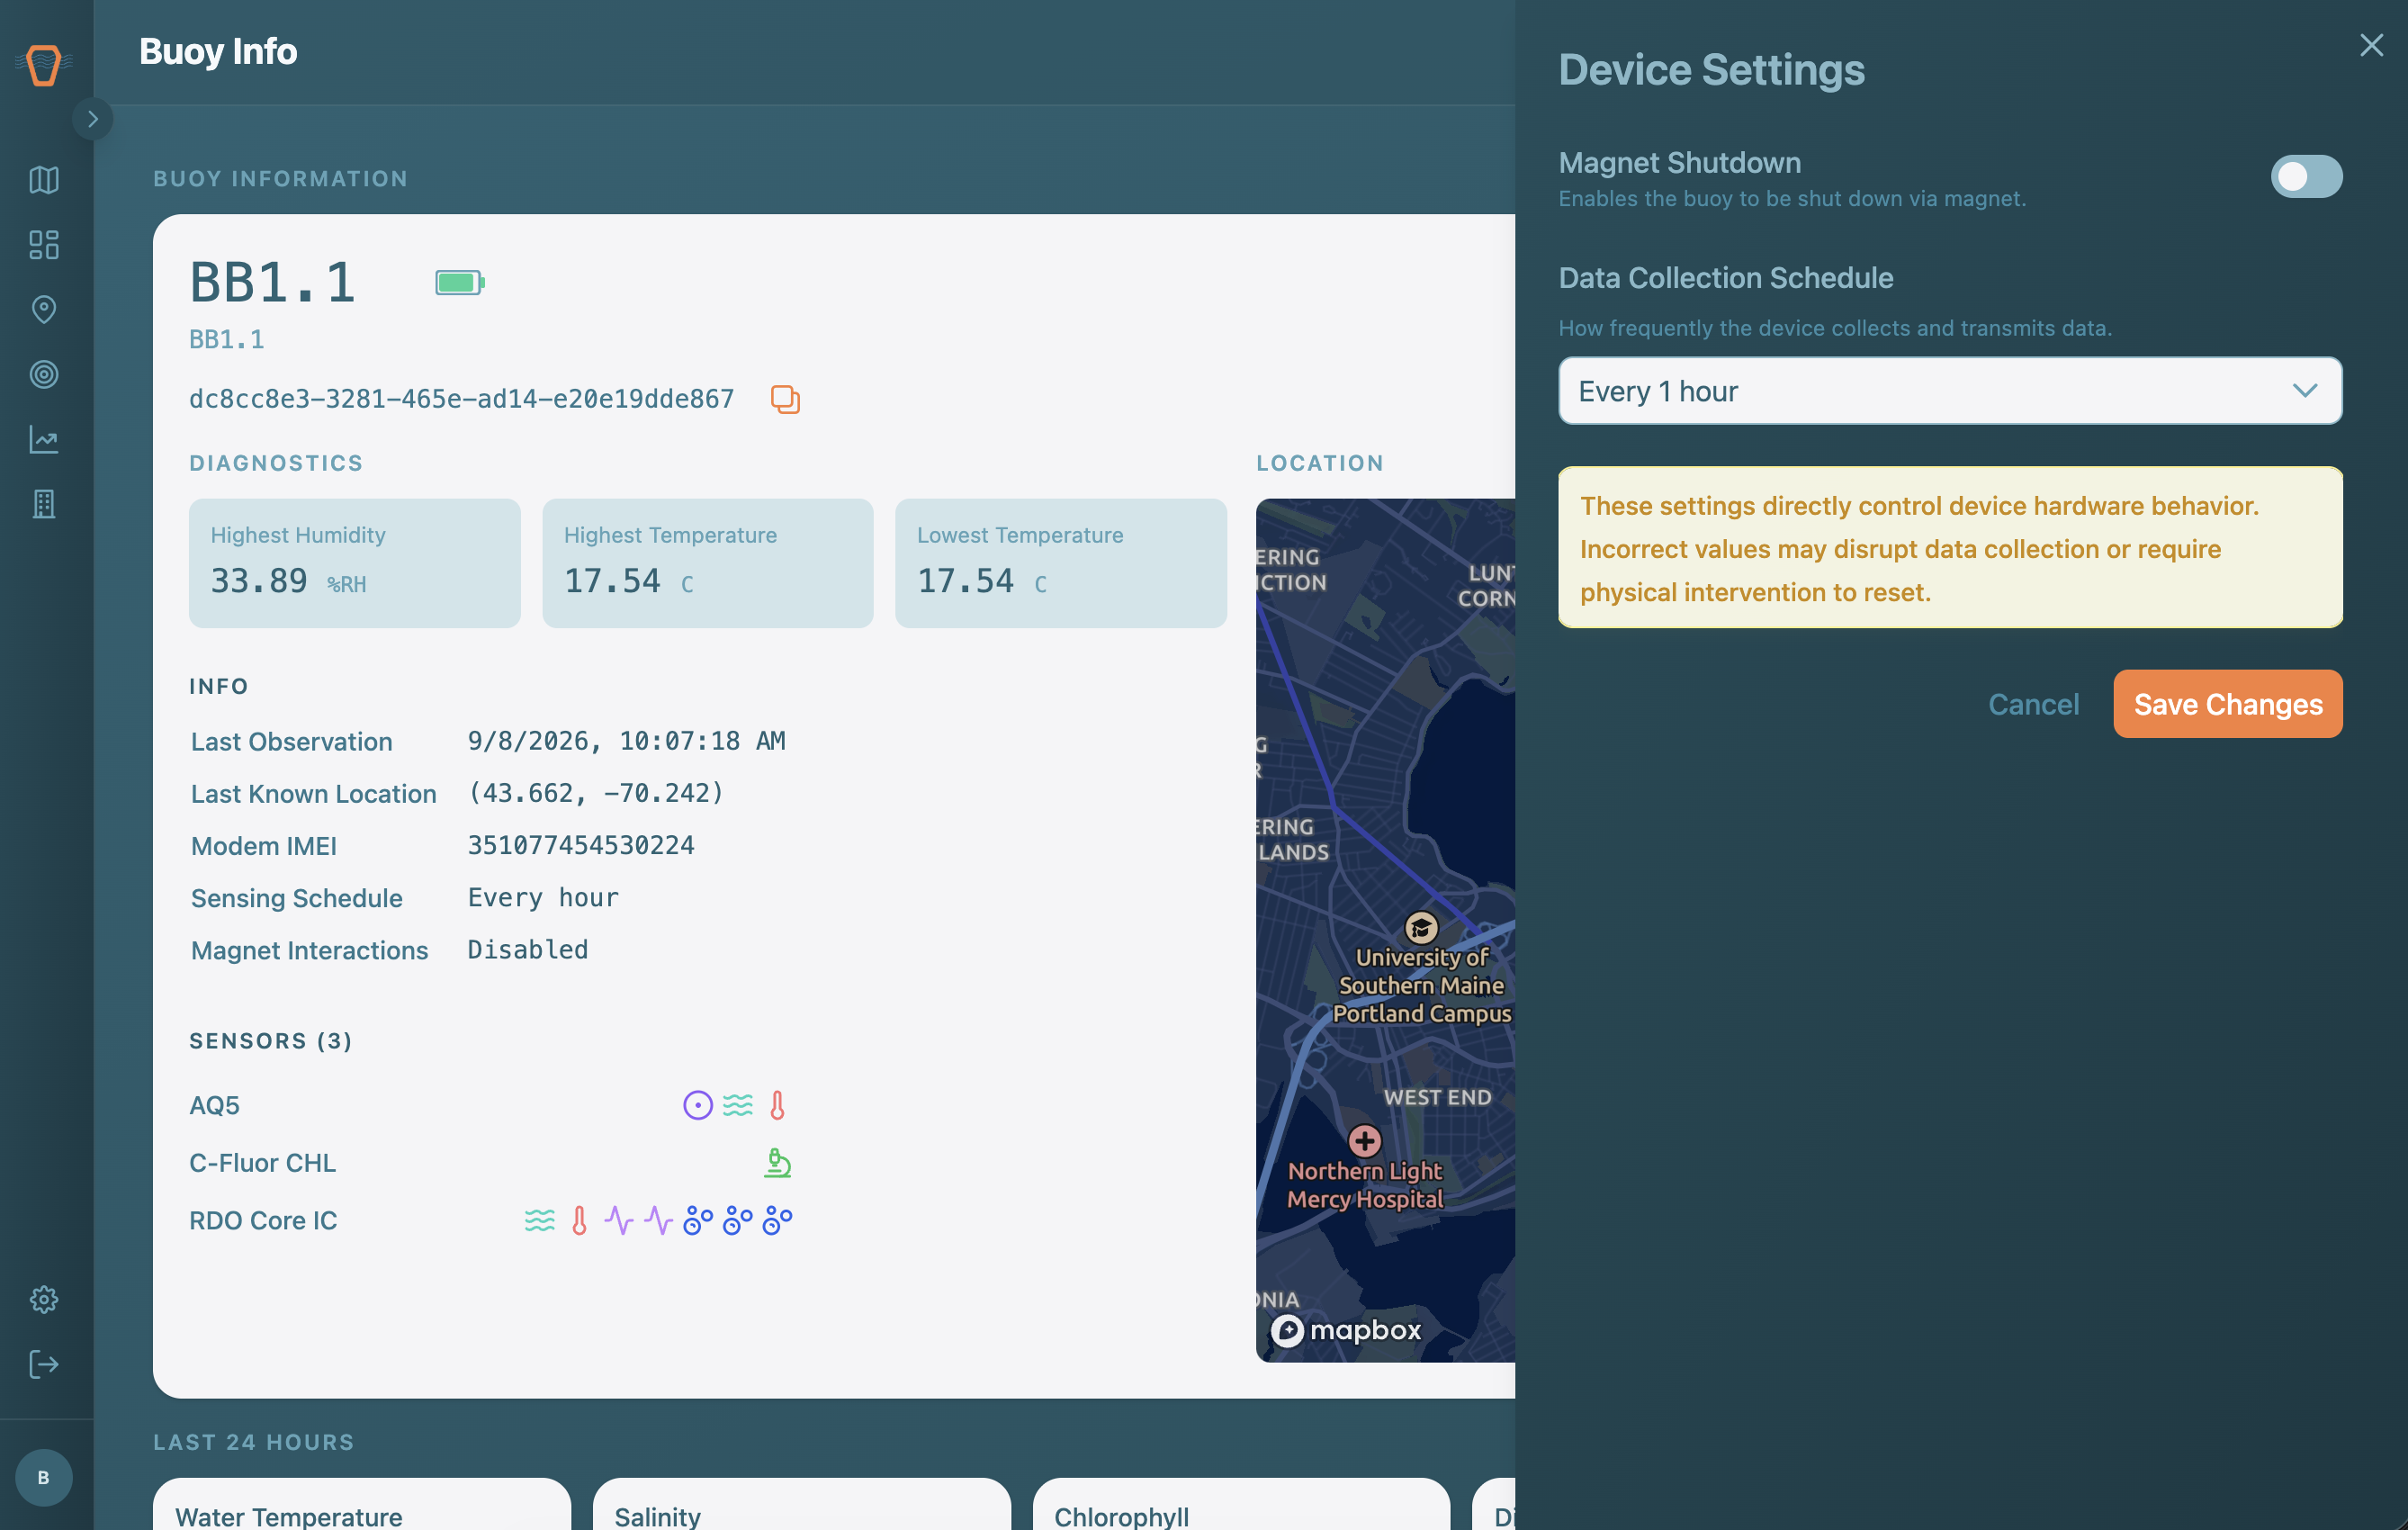
Once your Devices are confirmed online, we can set up some additional dashboard tooling to make analysis easier.
5. Create a Site
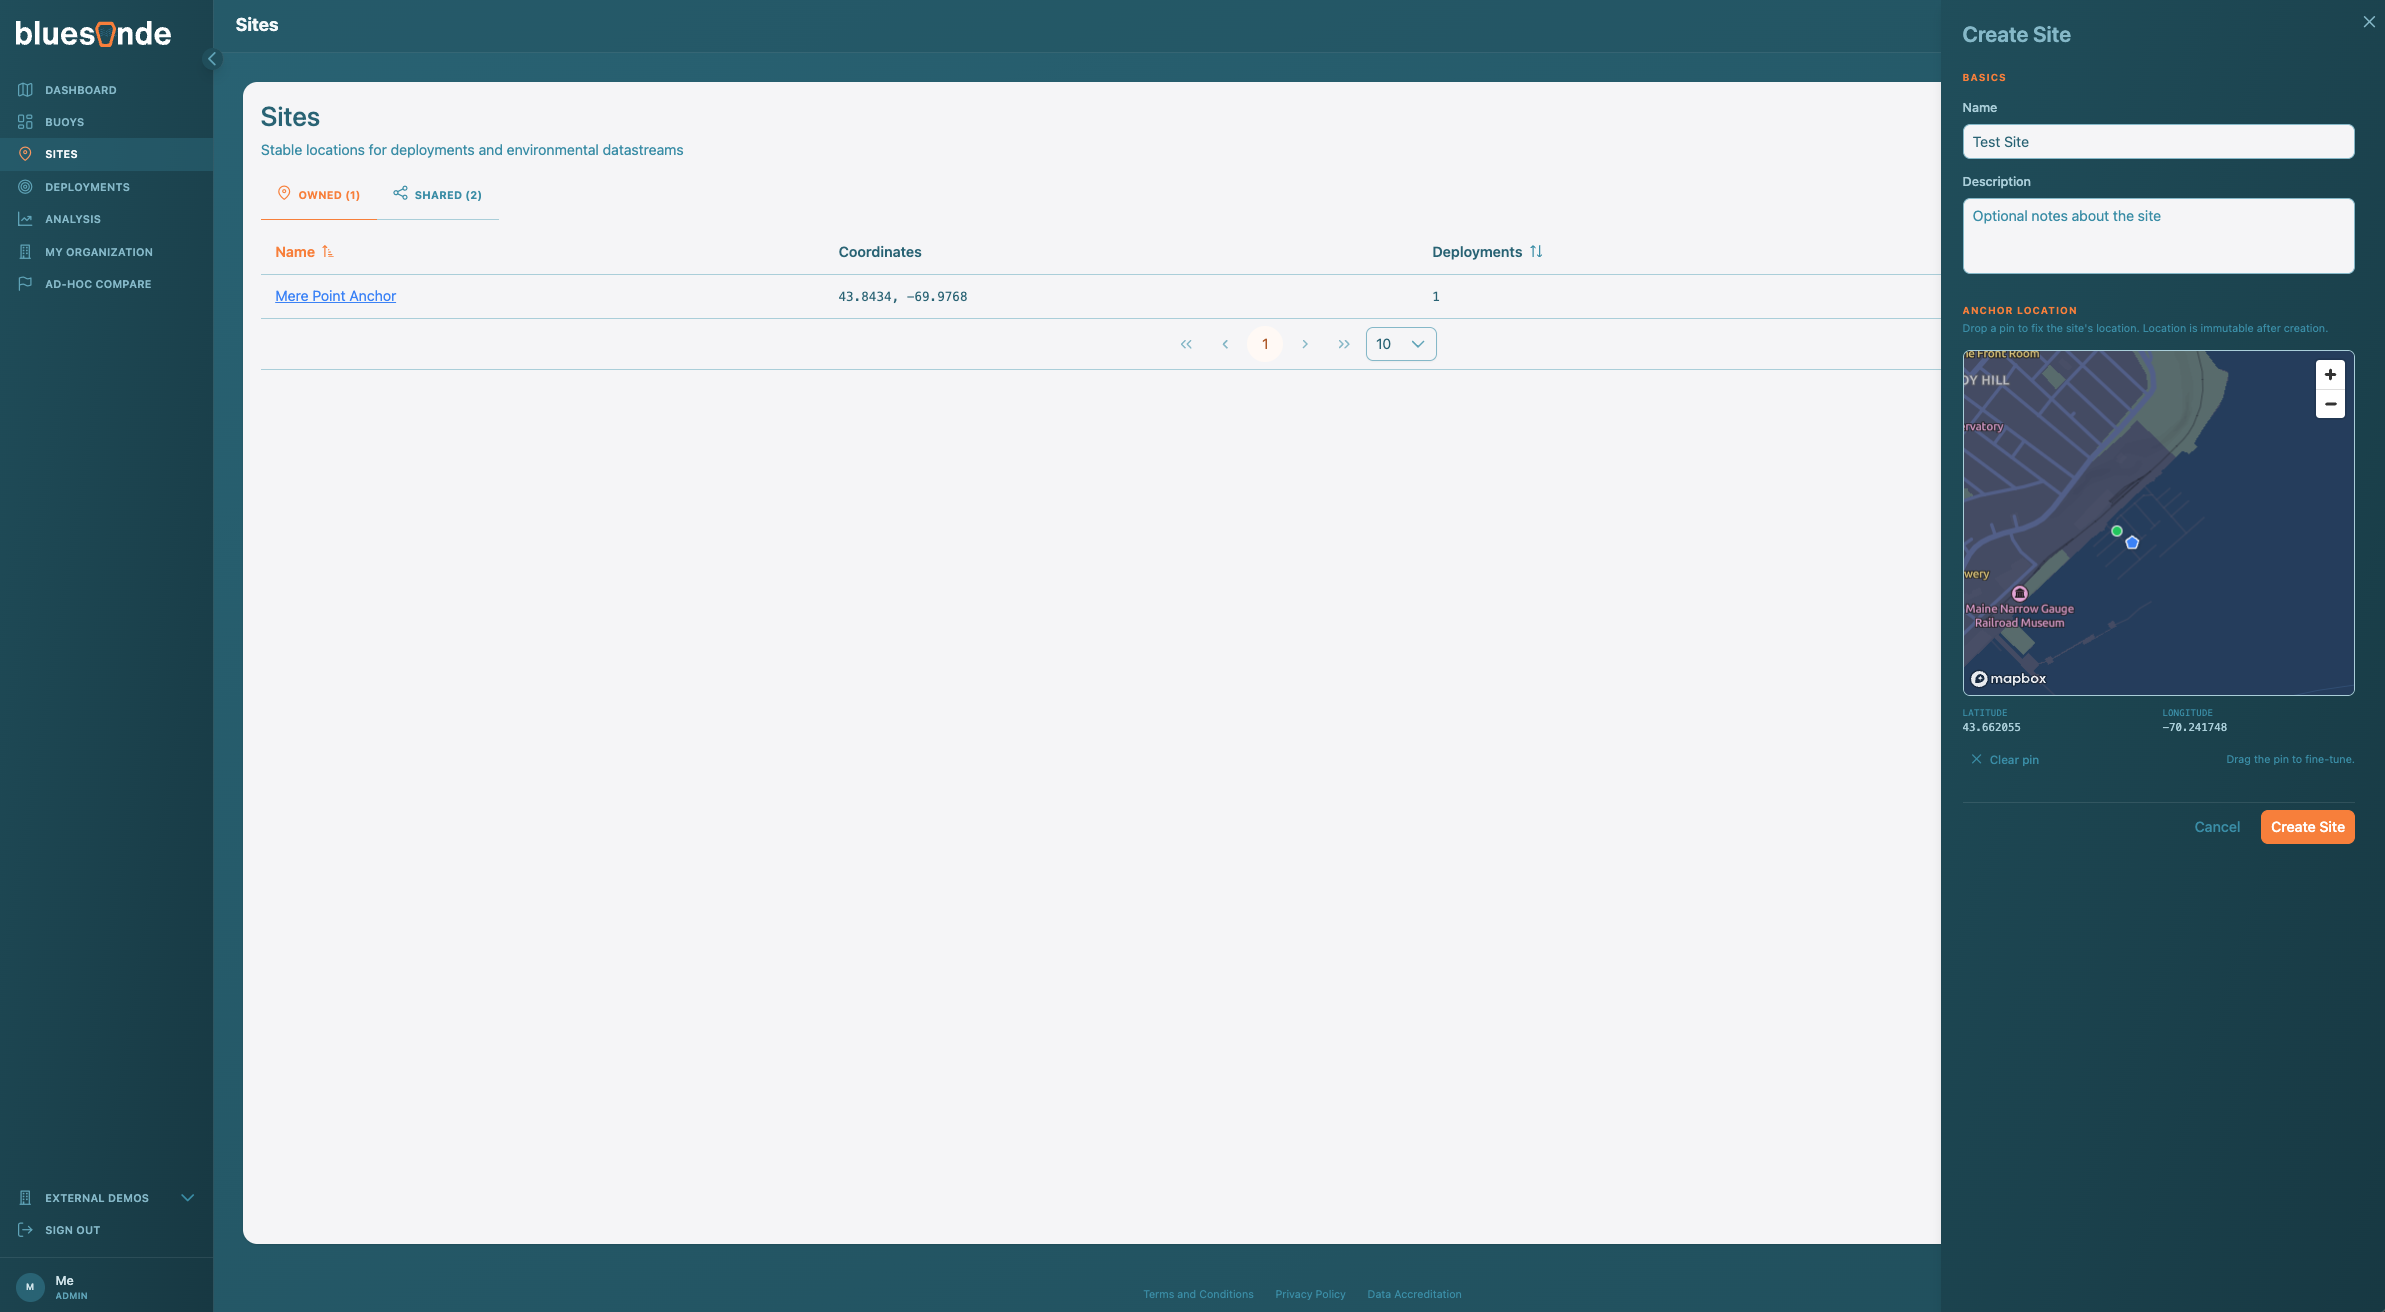
Start with a Site, which is a fixed, named location such as a bay or monitoring station. A Site is durable and reusable, so you can return to it across future Deployments. That makes it worth naming and placing carefully. On the Sites page, choose 'Create Site' and drop a pin at your location.
With a Site created, you can expand your analytical capabilities by subscribing to external data grounded at the Site. If you are an Organization Admin, open the Site Settings widget and subscribe to any external data of interest. This data will be backfilled 7 days, with optionality to further backfill depending on your data selection.
6. Create a Deployment and Set Up Continuous Monitoring
In addition to viewing fleet-wide and device-specific data, you can curate time-bounded subsets of your fleet for analysis via Deployments. On the Deployments page, choose 'Create Deployment', attach your Devices, and anchor it to the Site you just made so location and environmental data are consistent with the physical device setup.
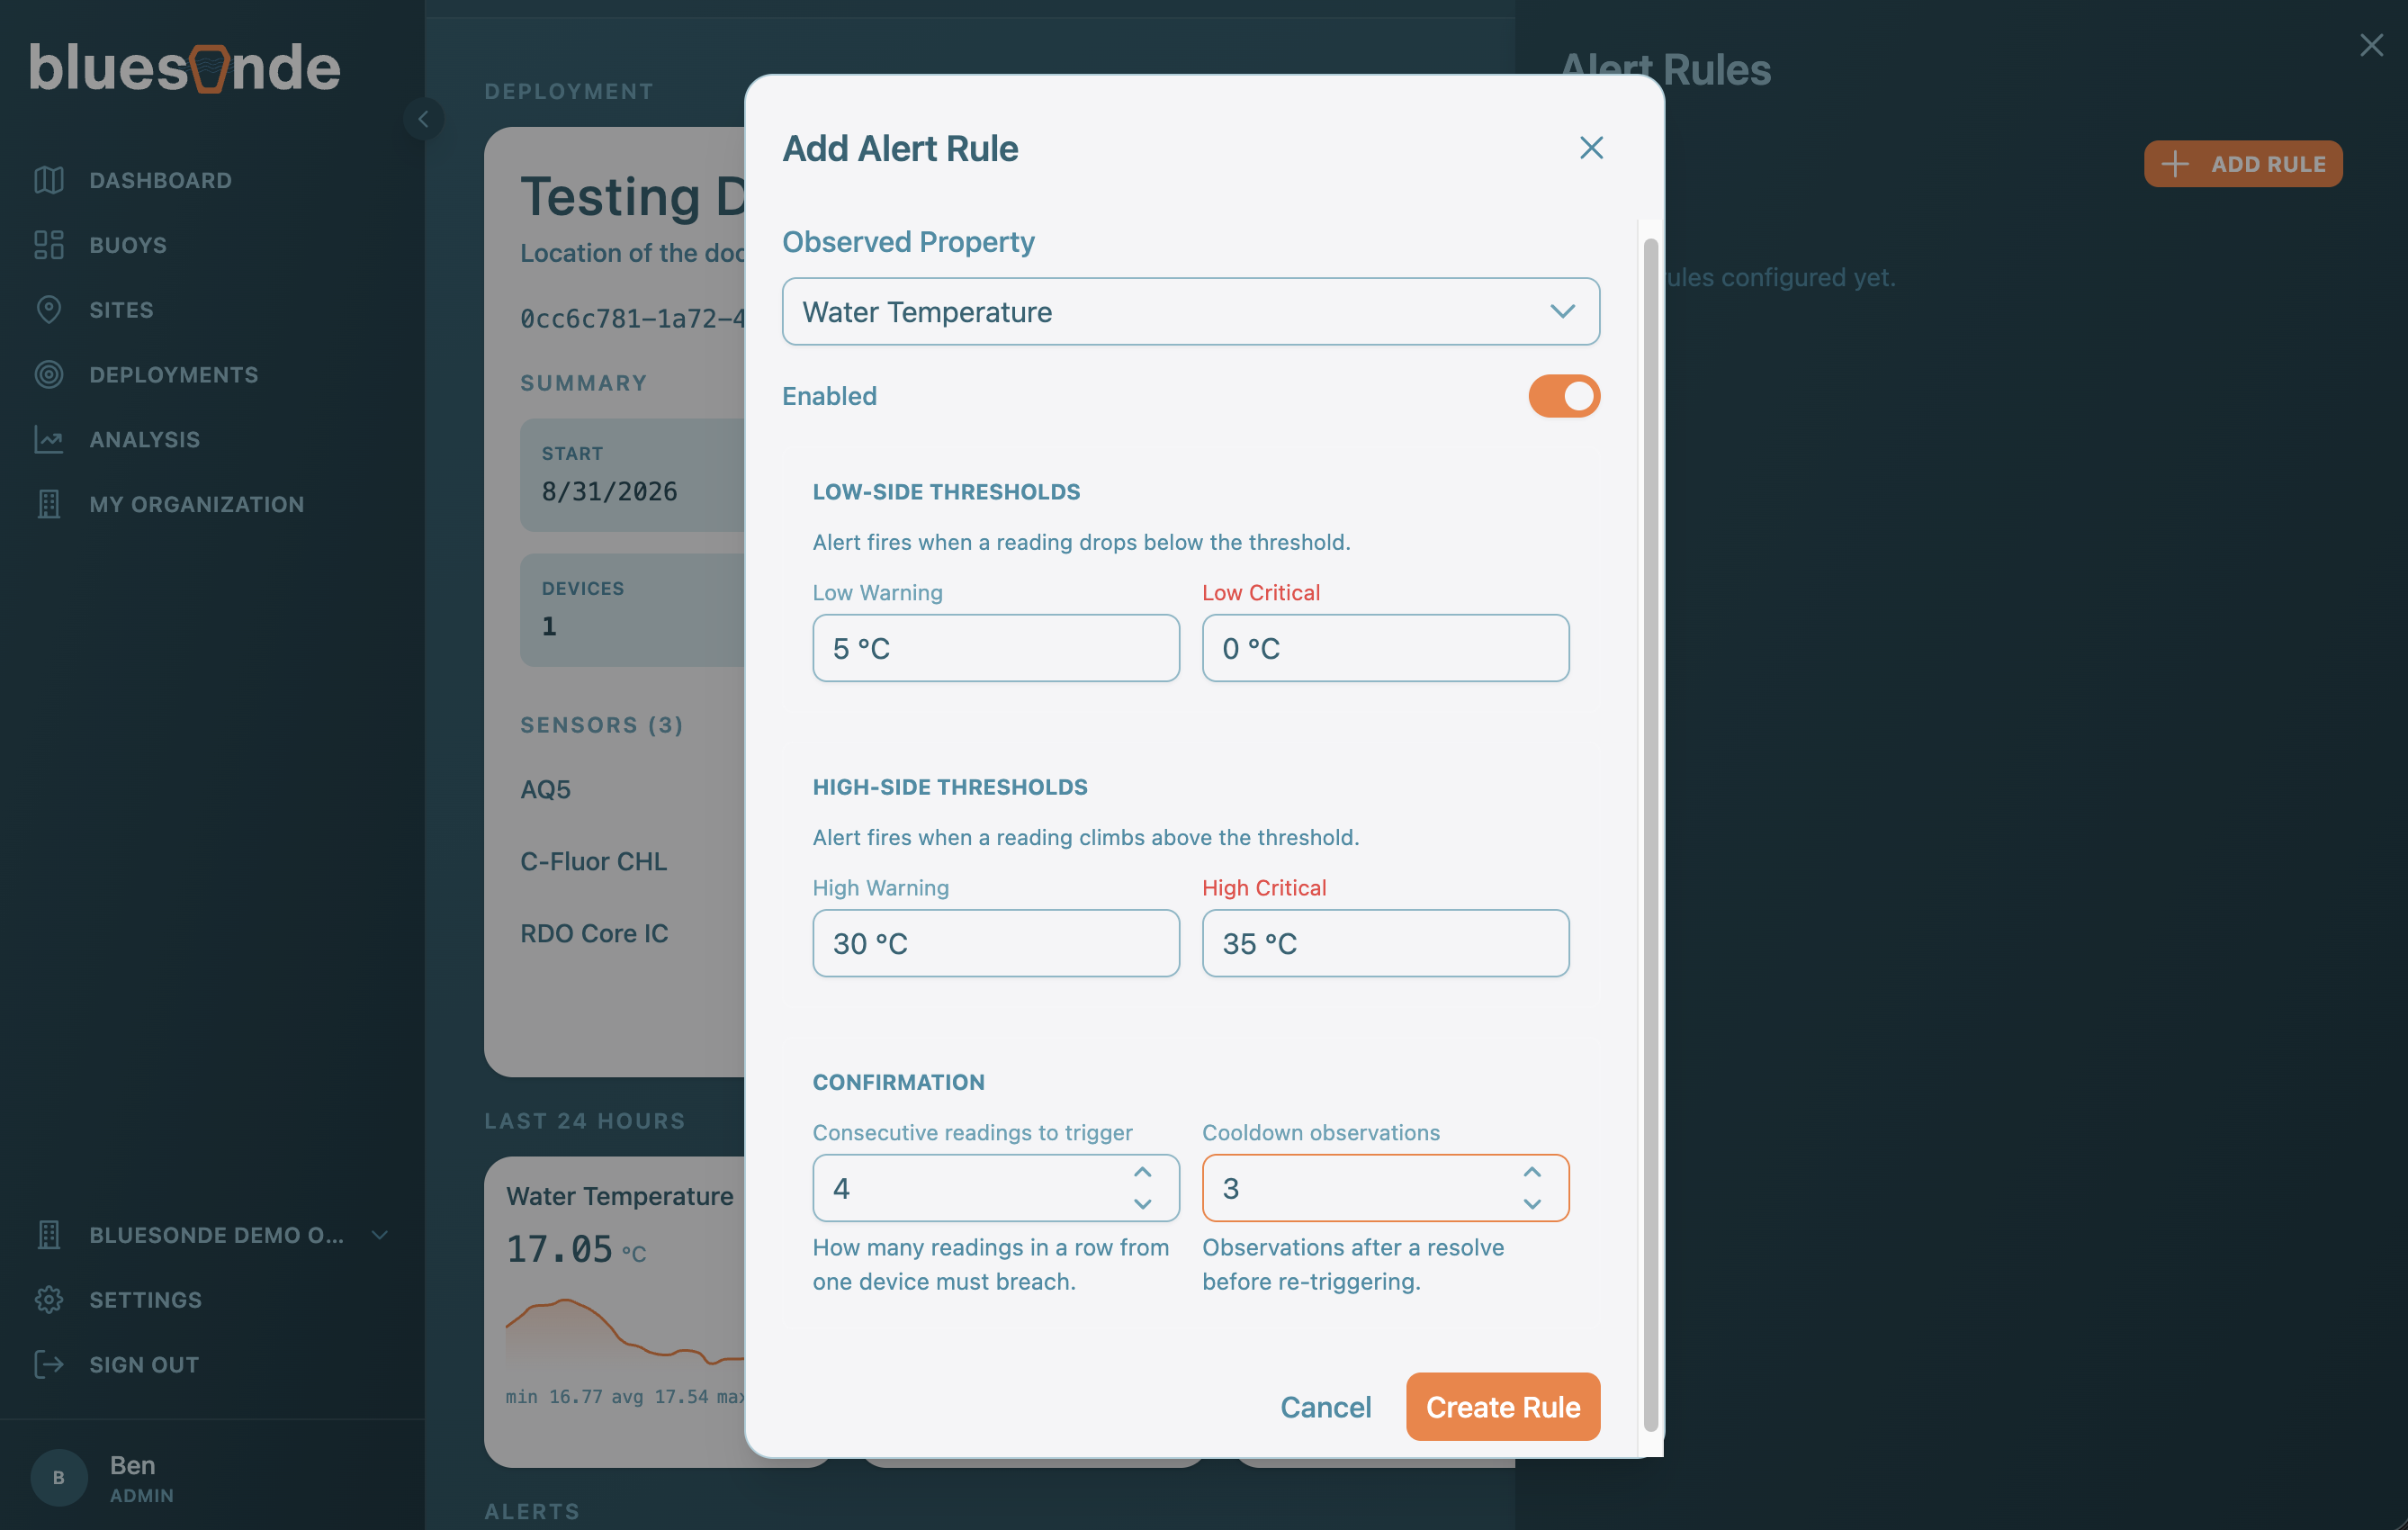
With a Deployment set up, we can unlock some additional monitoring capabilities: alerts and notifications. Specifically, on the Deployment Info page, you can set up two different types of continuous monitoring: Alert Rules and Geofences.
Alert Rules watch the data coming in from your Devices and raise an Alert when a reading or range of readings crosses a warning or critical threshold. Geofences monitor the location of your Devices to catch Devices that drift too far from the Site anchor.
Any alerts generated from your data will appear in the Deployment's Alert Timeline, as well as the notification bell widget in the top right. Additionally, users can subscribe to Email and SMS notifications for Alerts from the Notification Subscription widget.
7. Analyzing Your Data
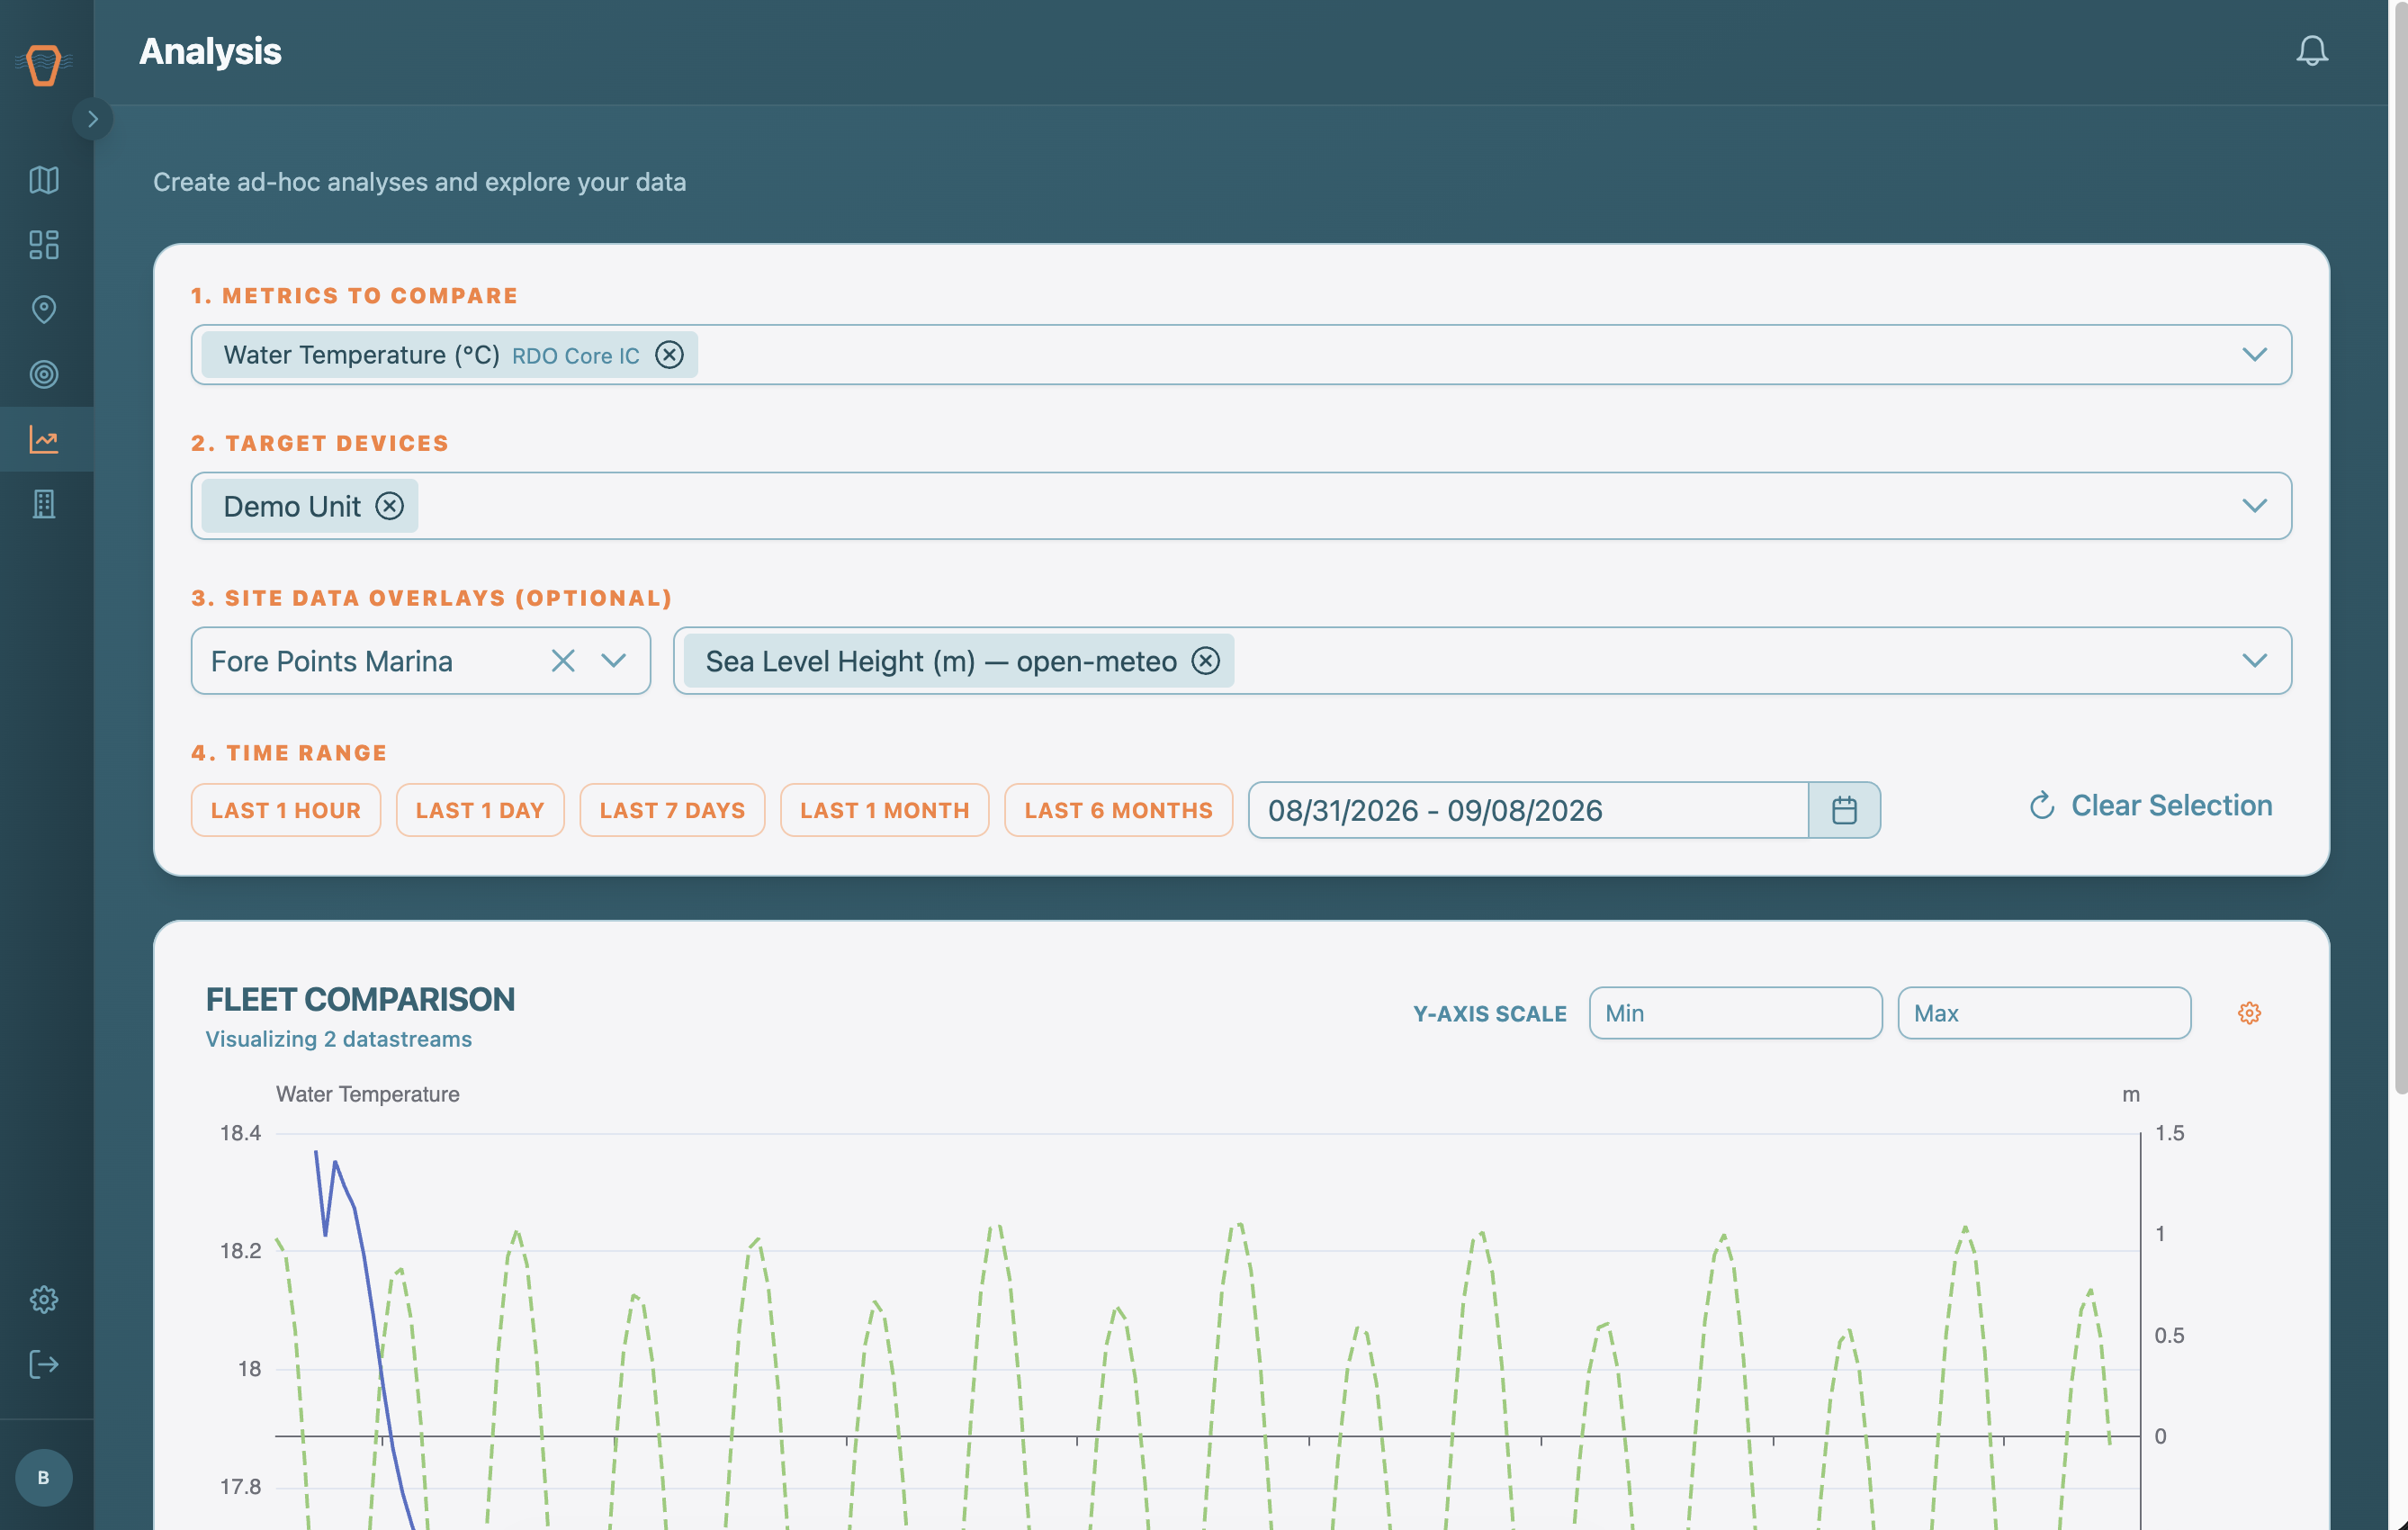
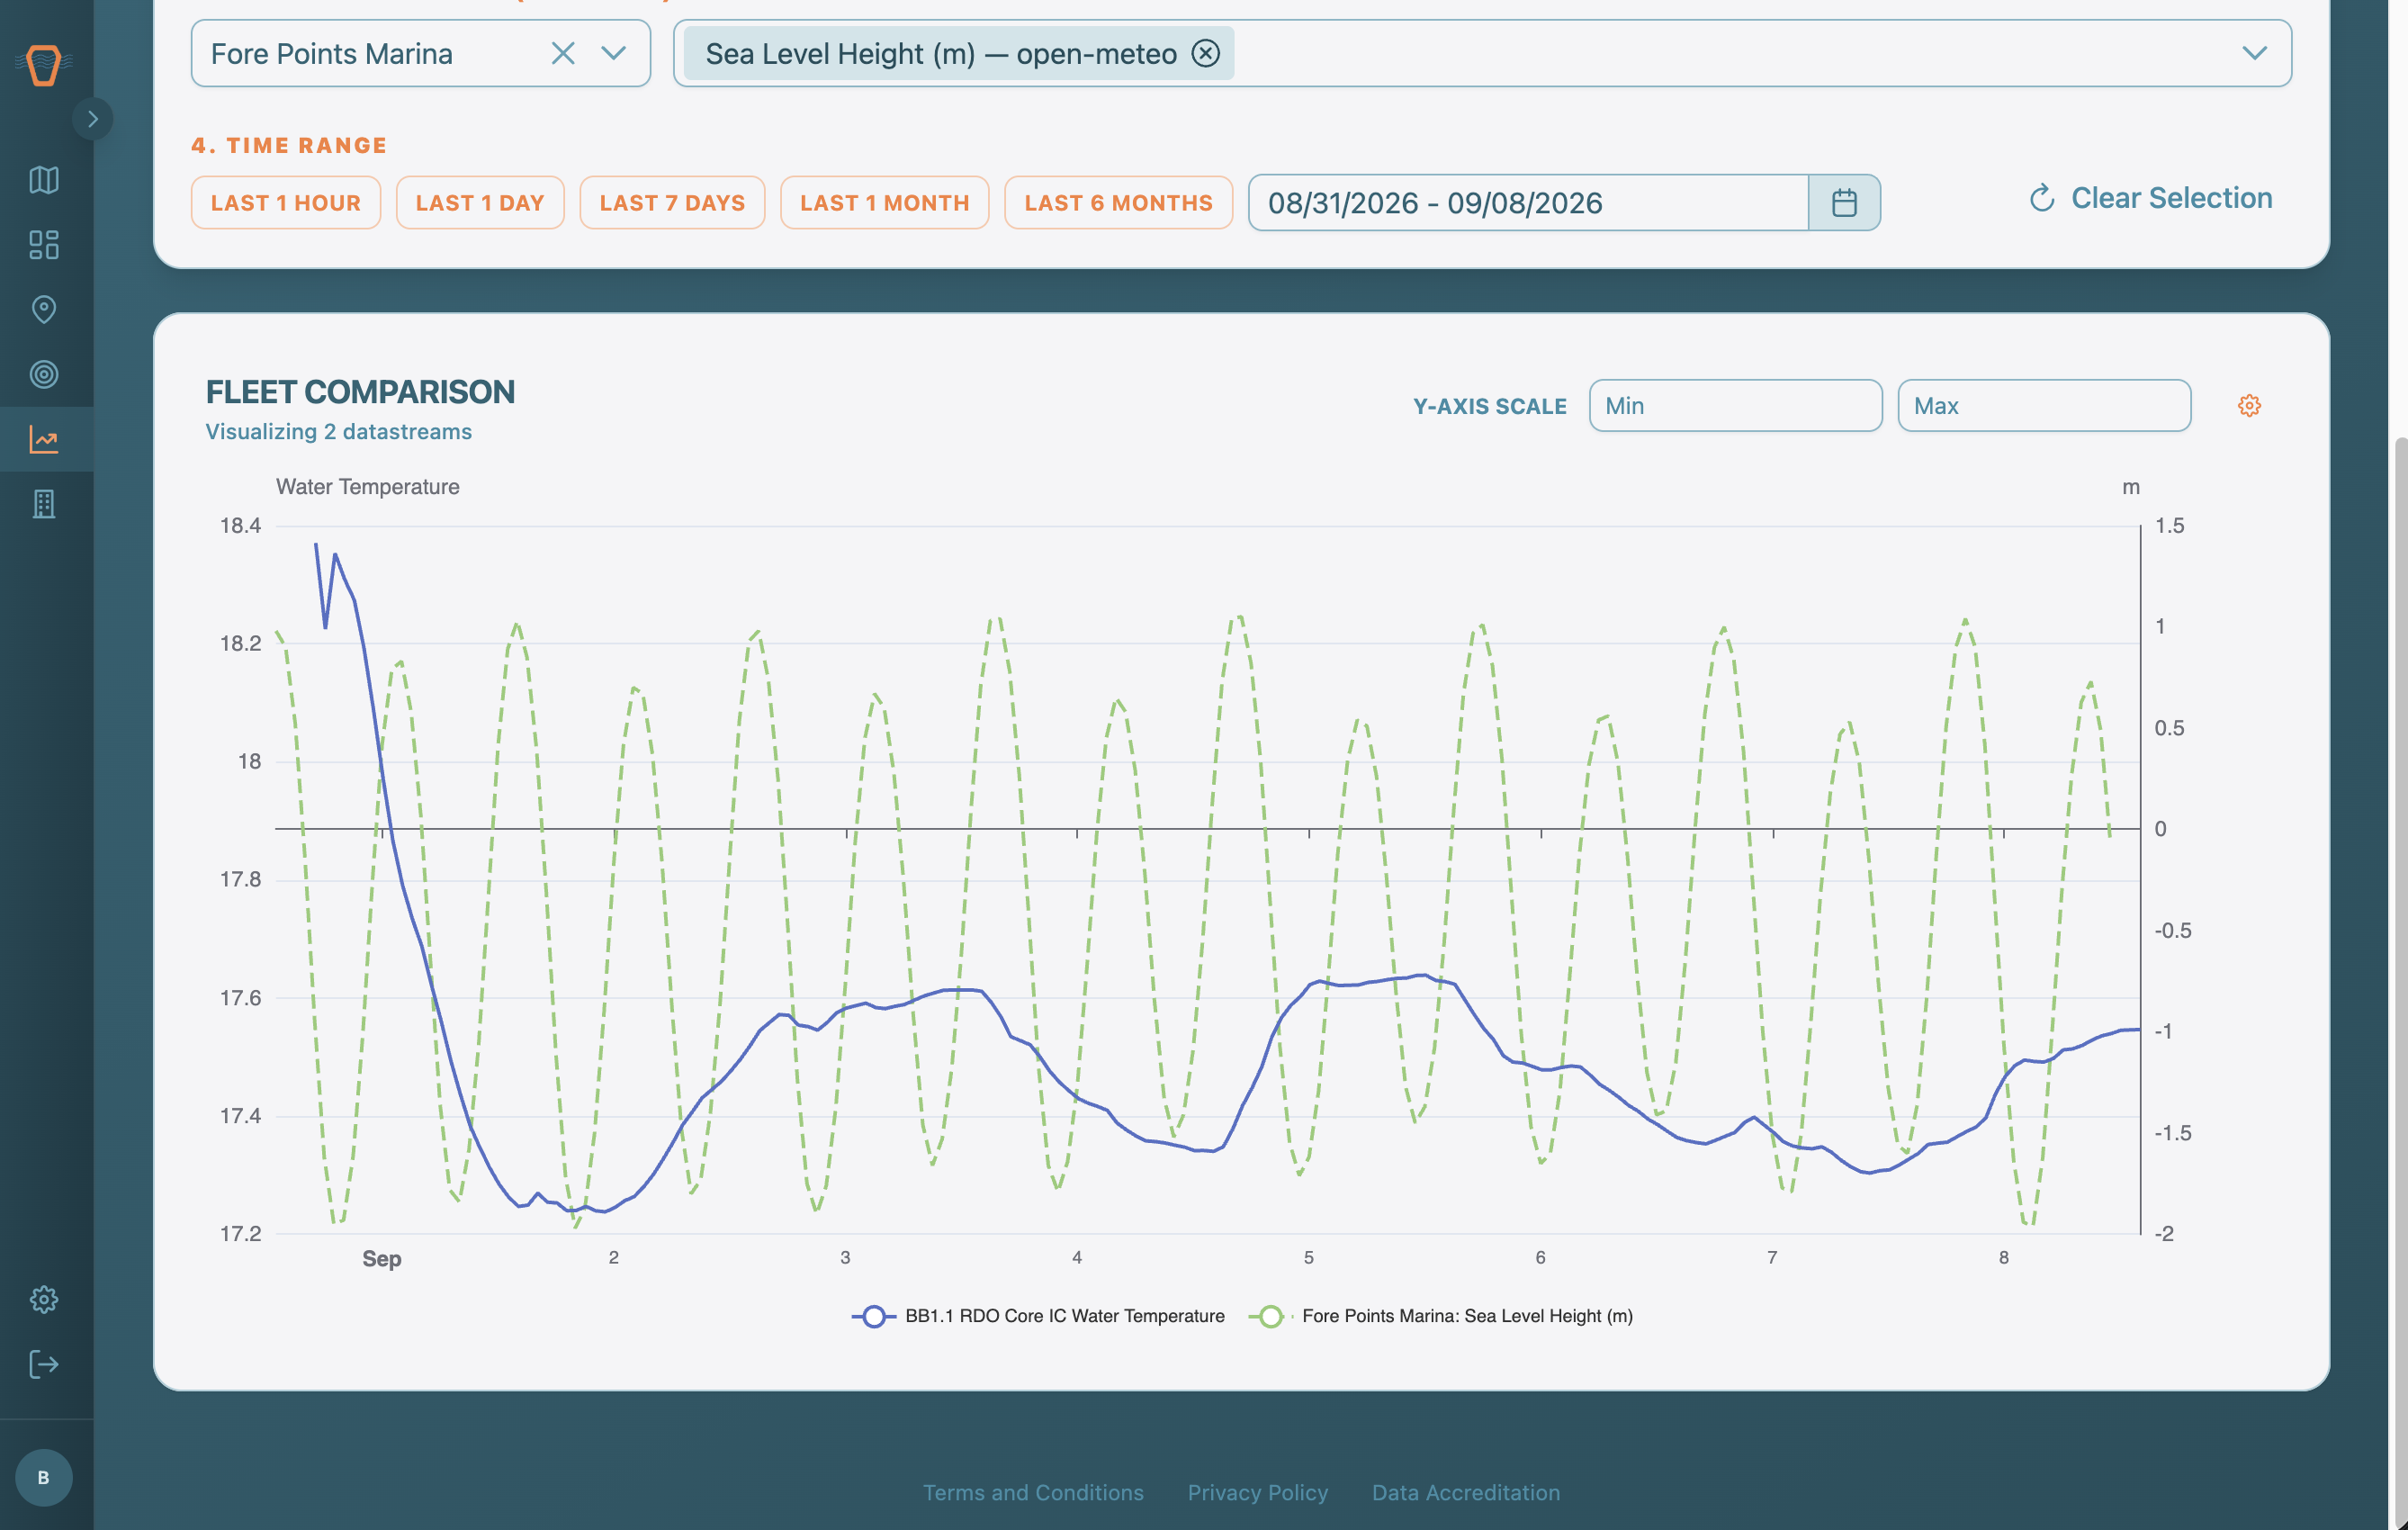
With all of this data now being collected, the next step is to explore it. The Analysis Page makes this easy. On this page, you can directly compare the different metrics coming from your Devices and being aggregated on your Sites.
On the Analysis page, pick the Observed Properties from the Devices you want to compare, add Site Datastream overlays for environmental context, and set a time range. The chart updates as you go, so you can immediately see how your readings and the surrounding environment relate.
There might come a point where our dashboard does not support the analysis you would like to perform. In these cases, we support data export; navigate to the Device or Deployment that contains the data you're interested in, scroll to the Readings Table, and hit the Export button. We also support data access programmatically via an API.
8. Invite Your Team and Share Your Data
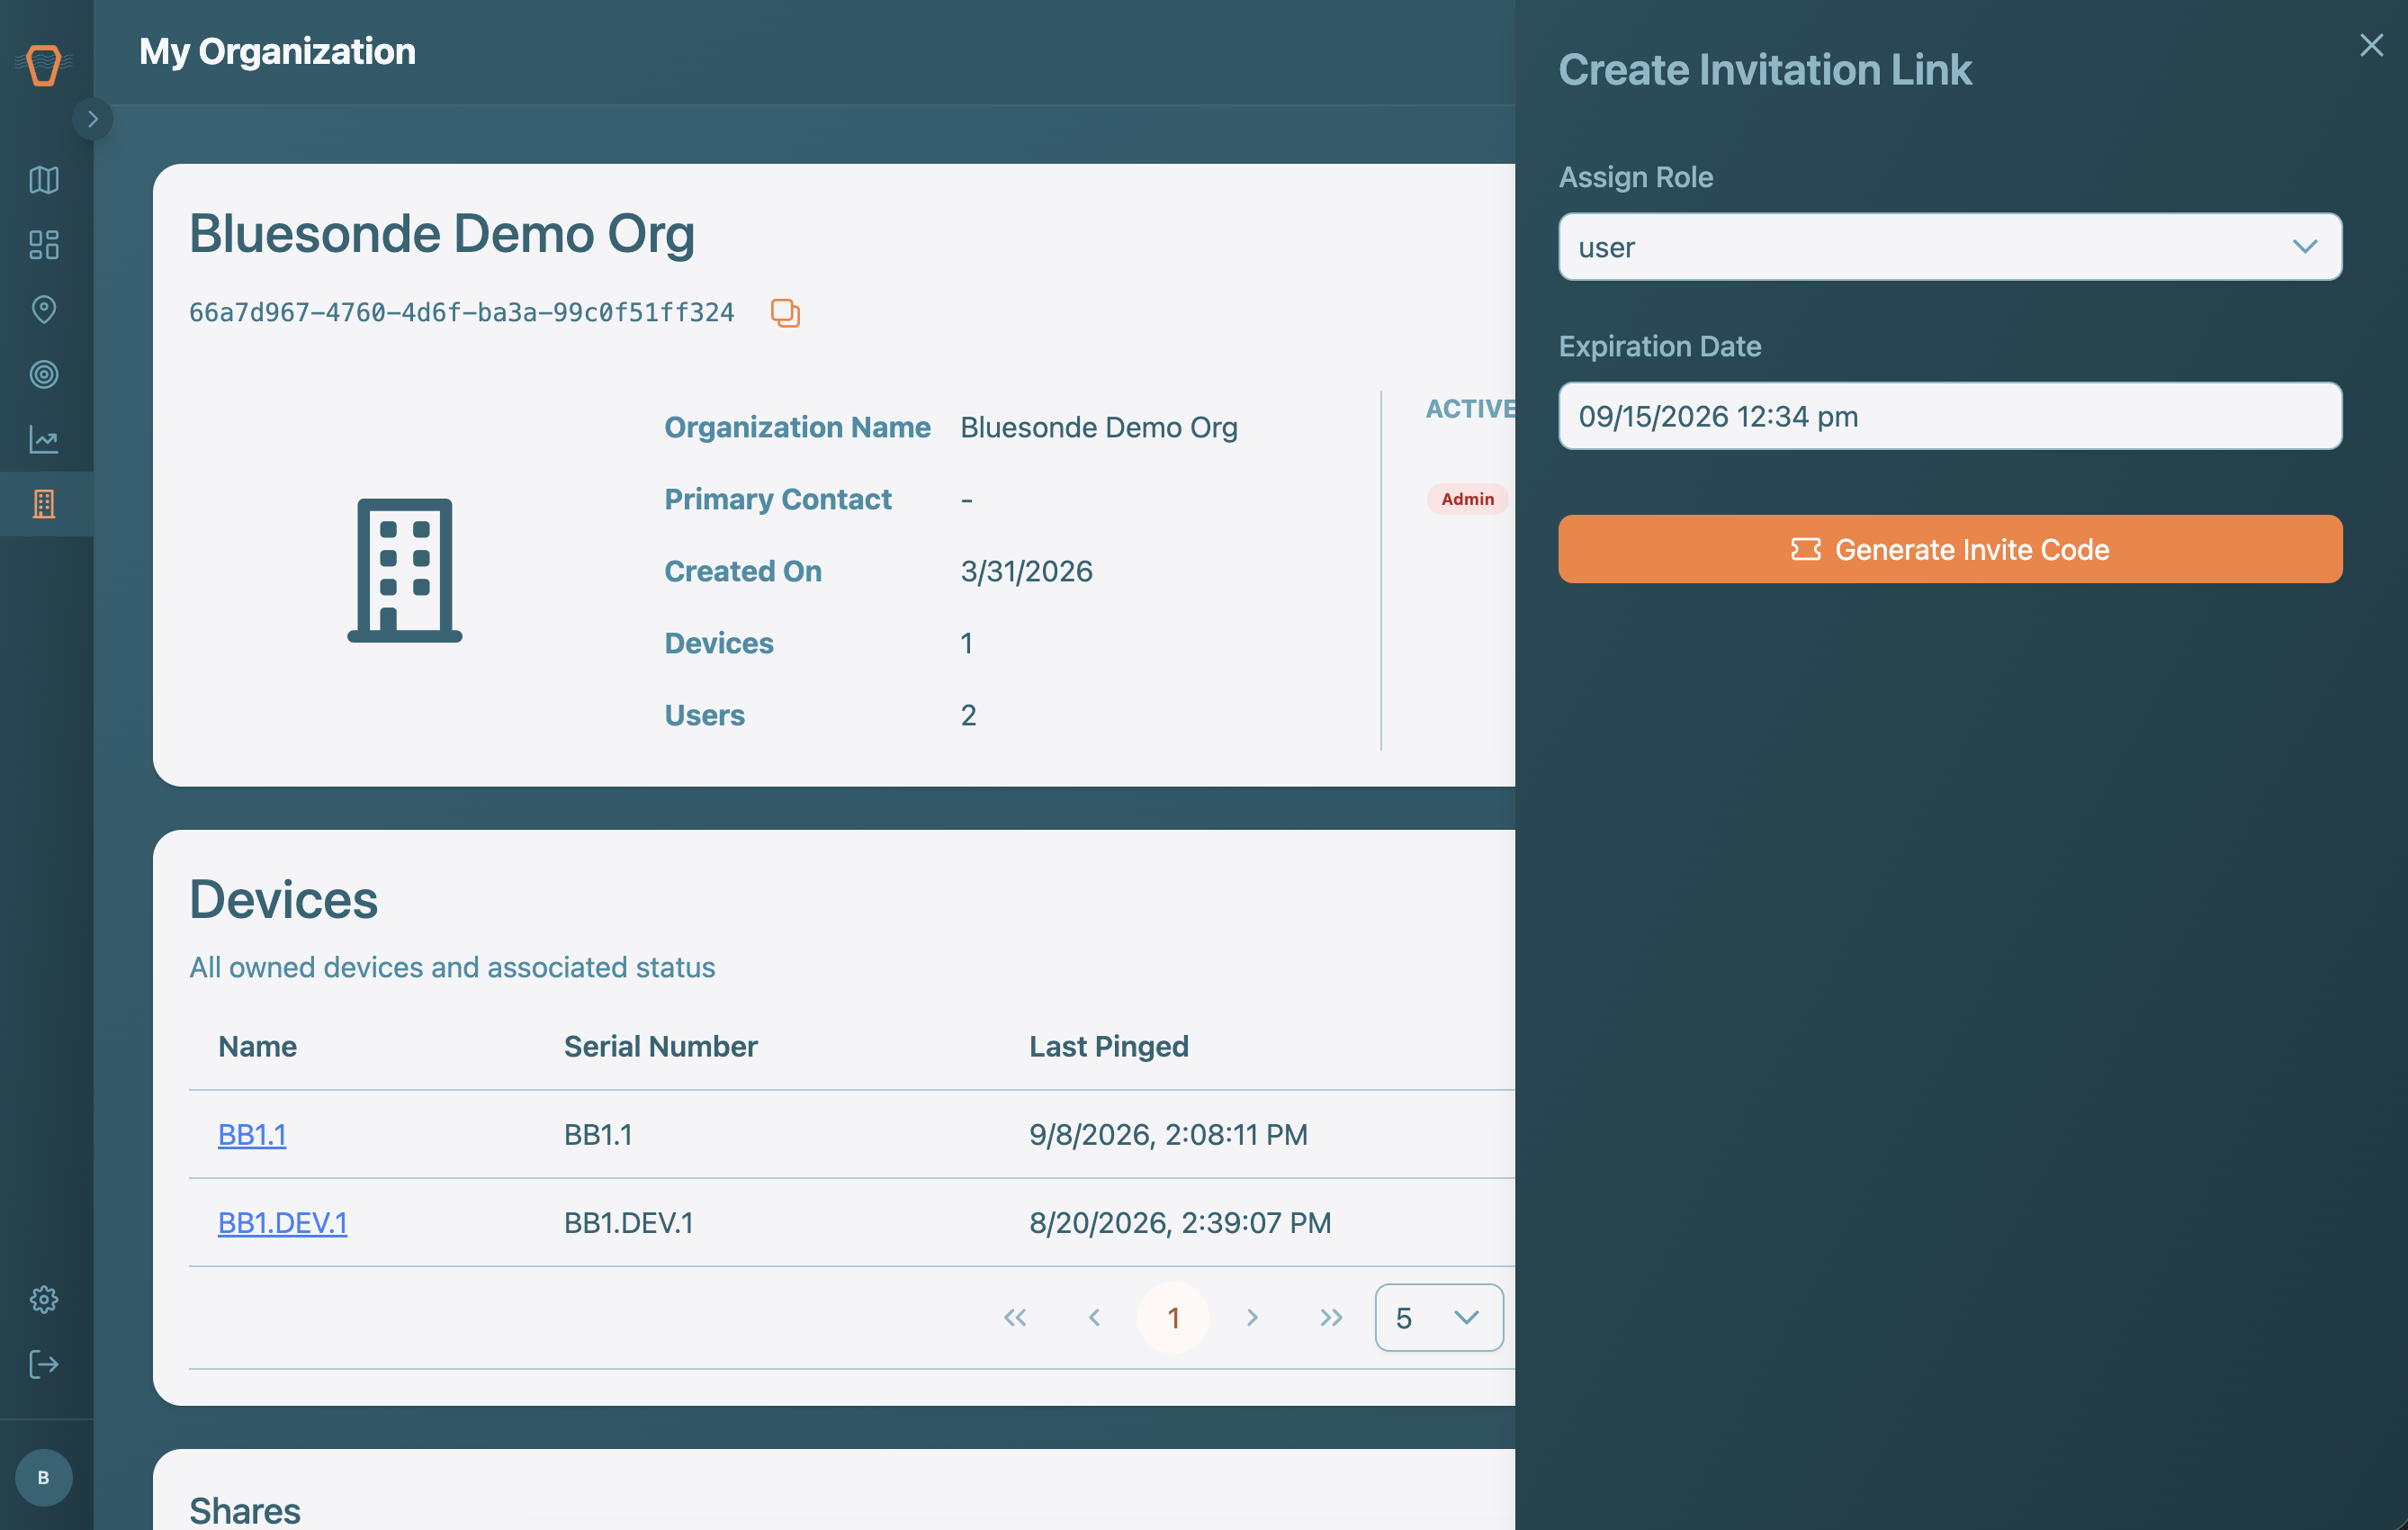
Bluesonde is more useful when your whole team sees the same data, so the next step is bringing them in. On the Organization page, Organization Admins can create an invitation link with a chosen role and expiration, then send it to teammates. Organization Admins can also manage members' roles and remove people from here.
In addition to inviting people to your organization, you can share individual Devices or Deployments with other Organizations or users outside your Organization by generating a Share Link. To do this, open the Share widget on any of your Devices or Deployments, select your sharing settings, generate a link, and send it to the desired party. They will then be able to access data you shared so long as you keep the access open.
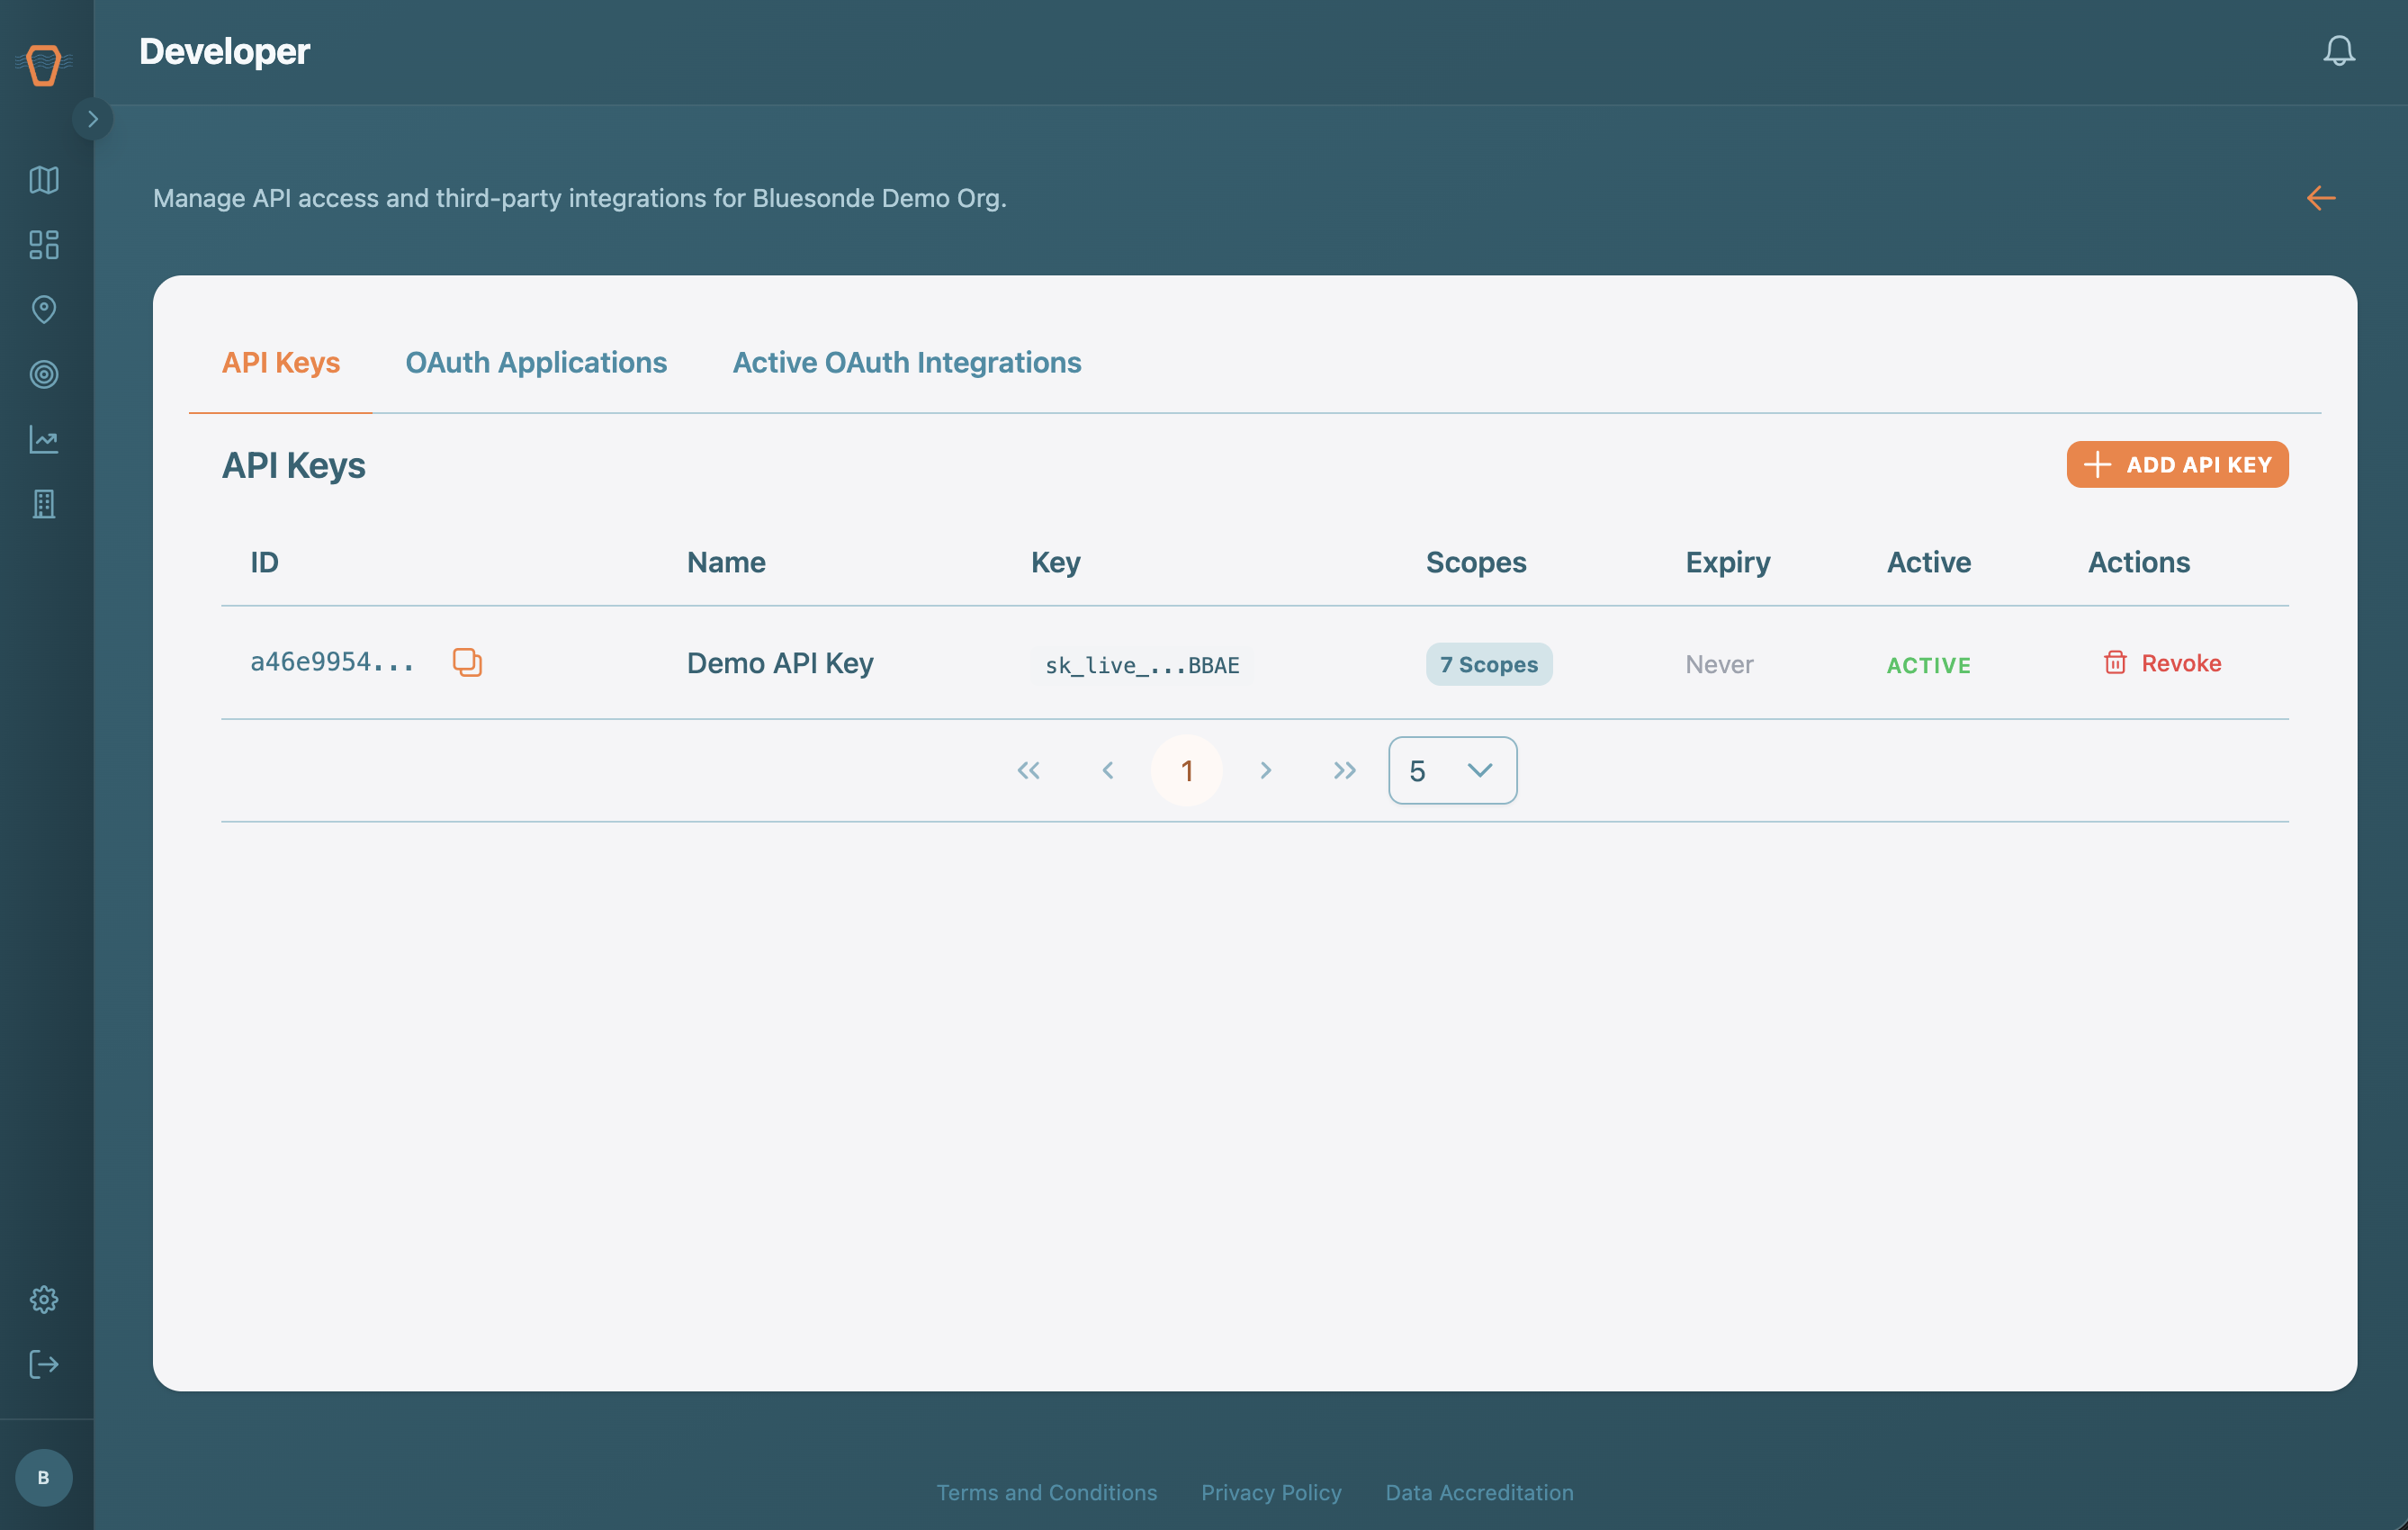
9. Developers and Third-Party Apps (Optional)
This one is for teams who want to pull data out of the Dashboard and into their own tools. Open Developer Settings to create an API Key with the scopes you need for your own scripts. To let another application connect on behalf of your users, register an OAuth Application, and enable a Webhook to receive events as they happen. For request details and the full authentication flow, see the API documentation.