Analysis
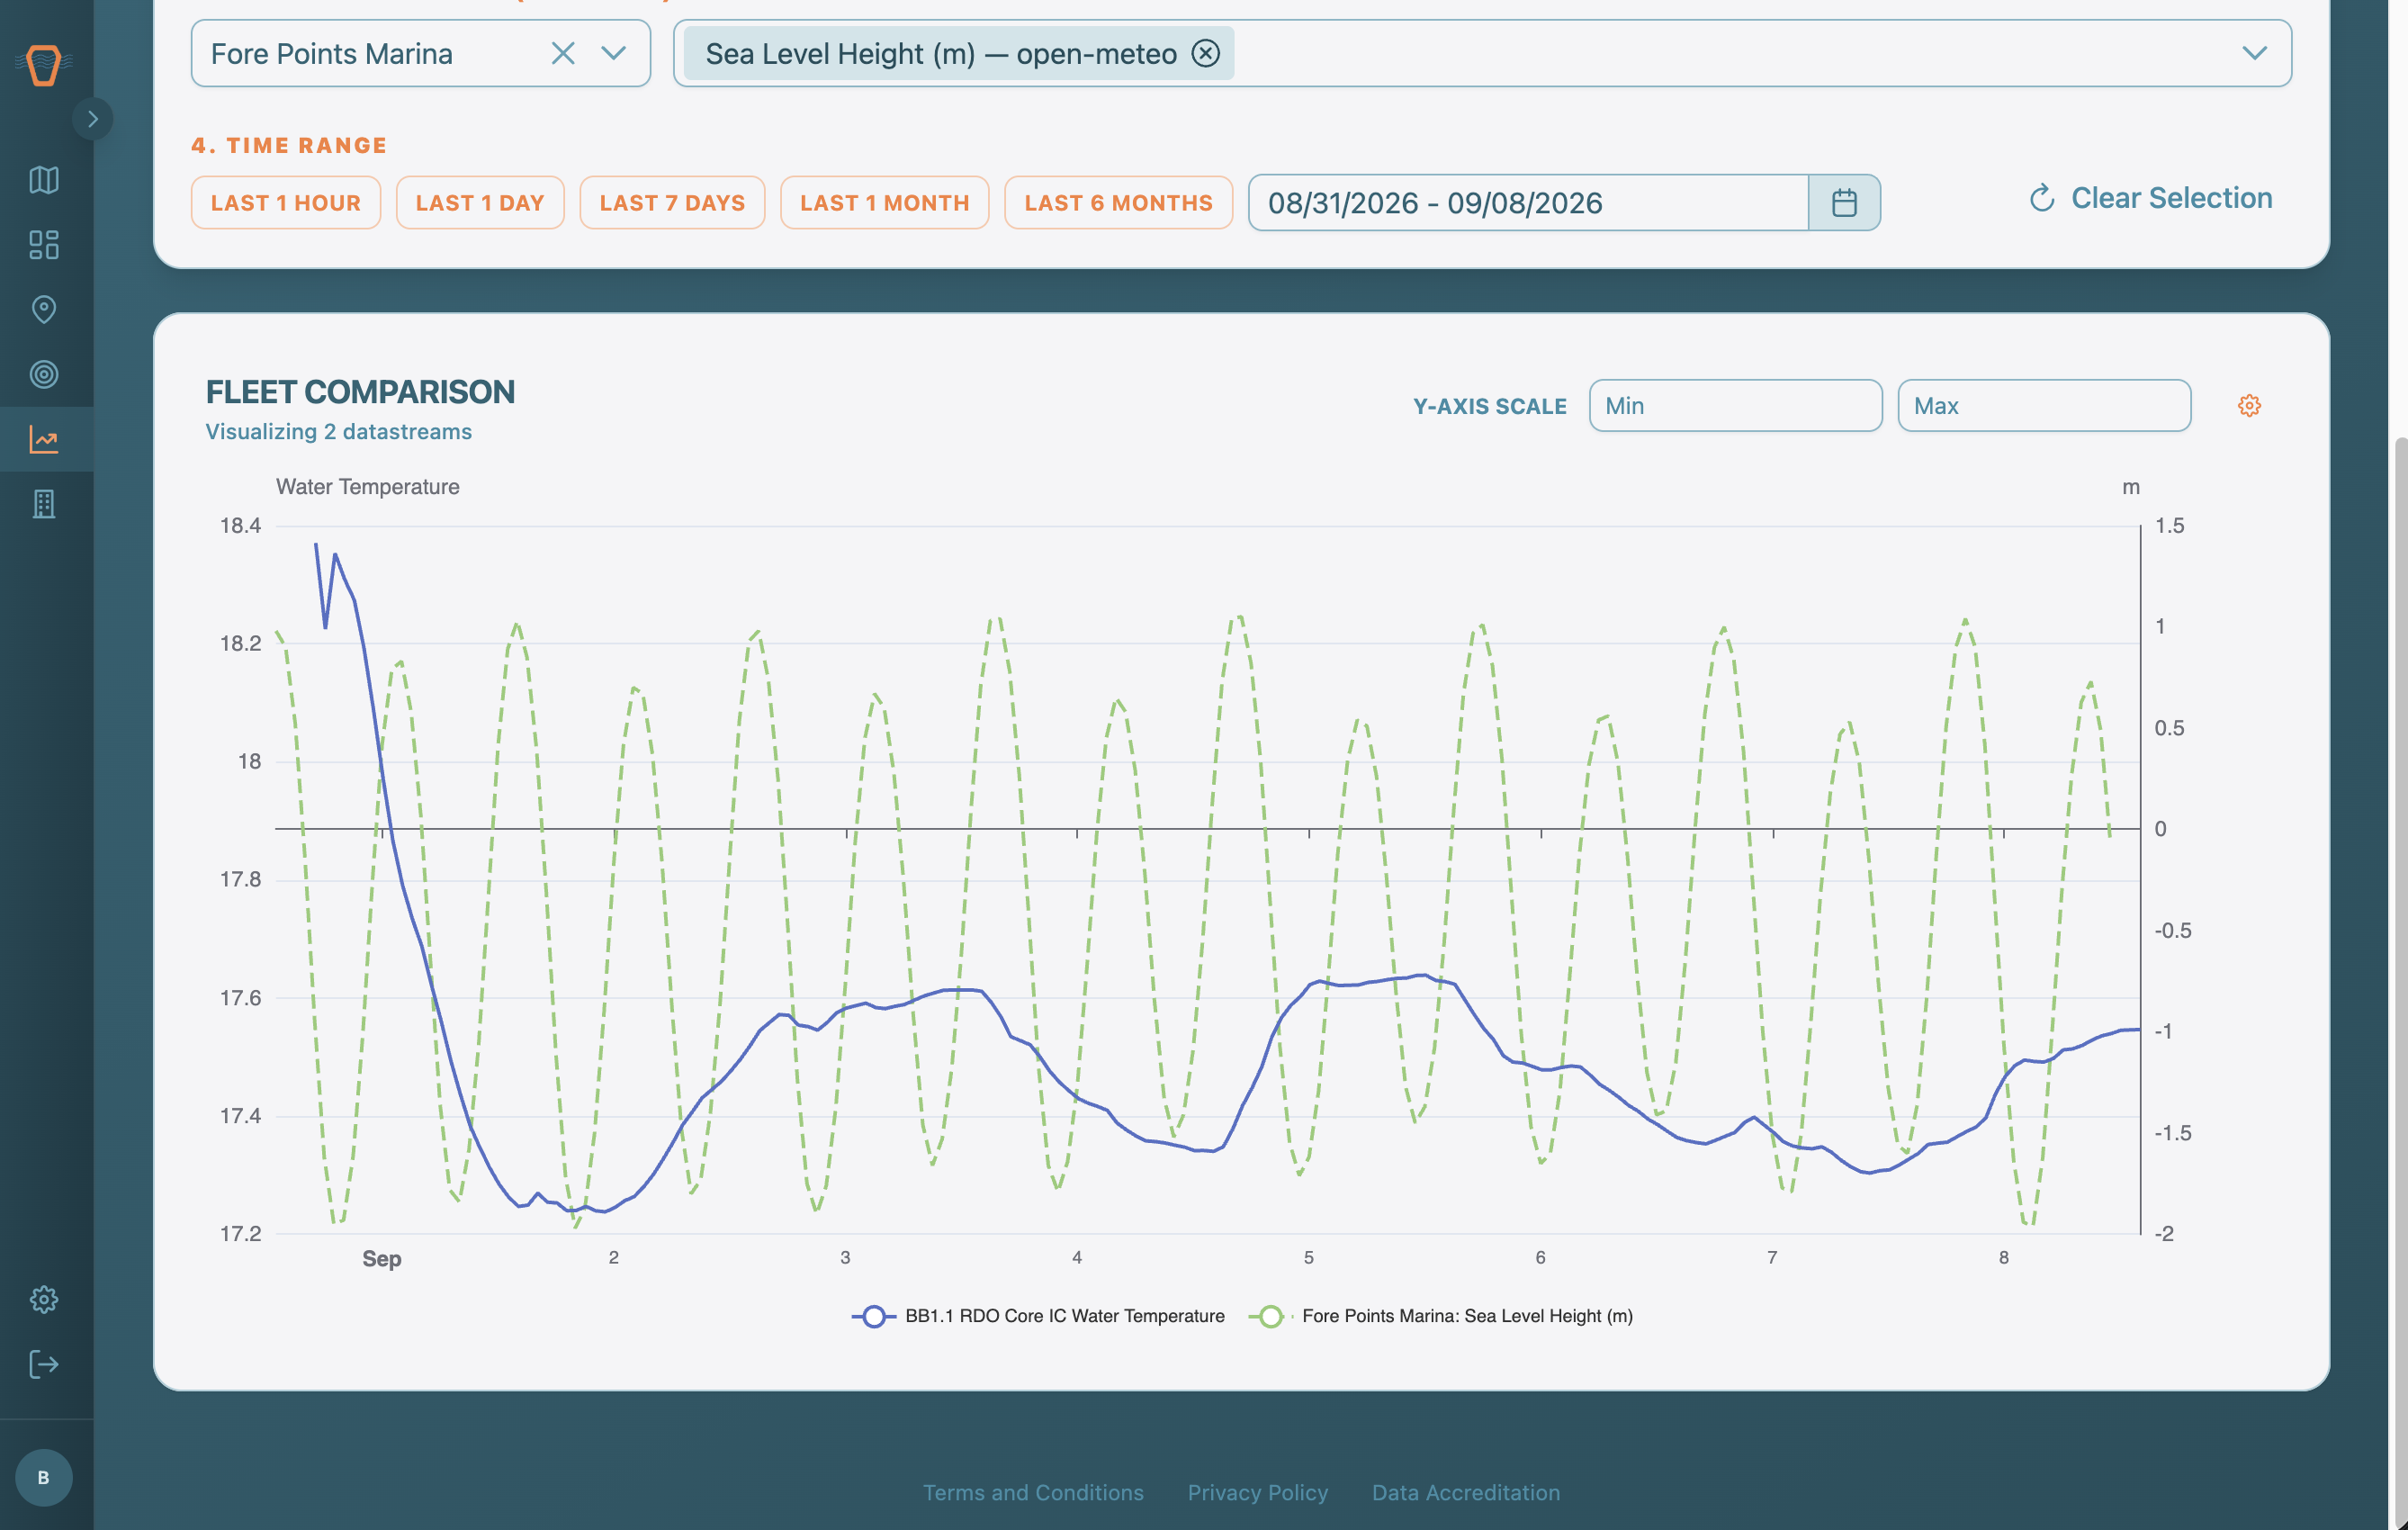
The Analysis Page allows you to overlay data from different devices, sensors, and sites against each other. This functionality enables you to explore the various dimensions of your data, and the environment's impact upon them.
Selecting Metrics to Compare
To begin analyzing your data, use the 'Metrics' dropdown to select your parameters of interest. Metrics here are unique to the underlying sensor type, so if your buoys have multiple sensors that report the same parameters, ensure you make the appropriate selections.
After selecting your parameters, use the 'Devices' dropdown to choose which of your buoys you'd like to see data from.
To index into external environmental data, you can use the Site subscription feature. Once an organization administrator subscribes a Site to external data, you can select the Site or Sites you're interested in, as well as the underlying subscriptions you'd like overlaid in the Site dropdown.
Finally, you can use the date range selector to modify the date range of the underlying data.
The Comparison Chart
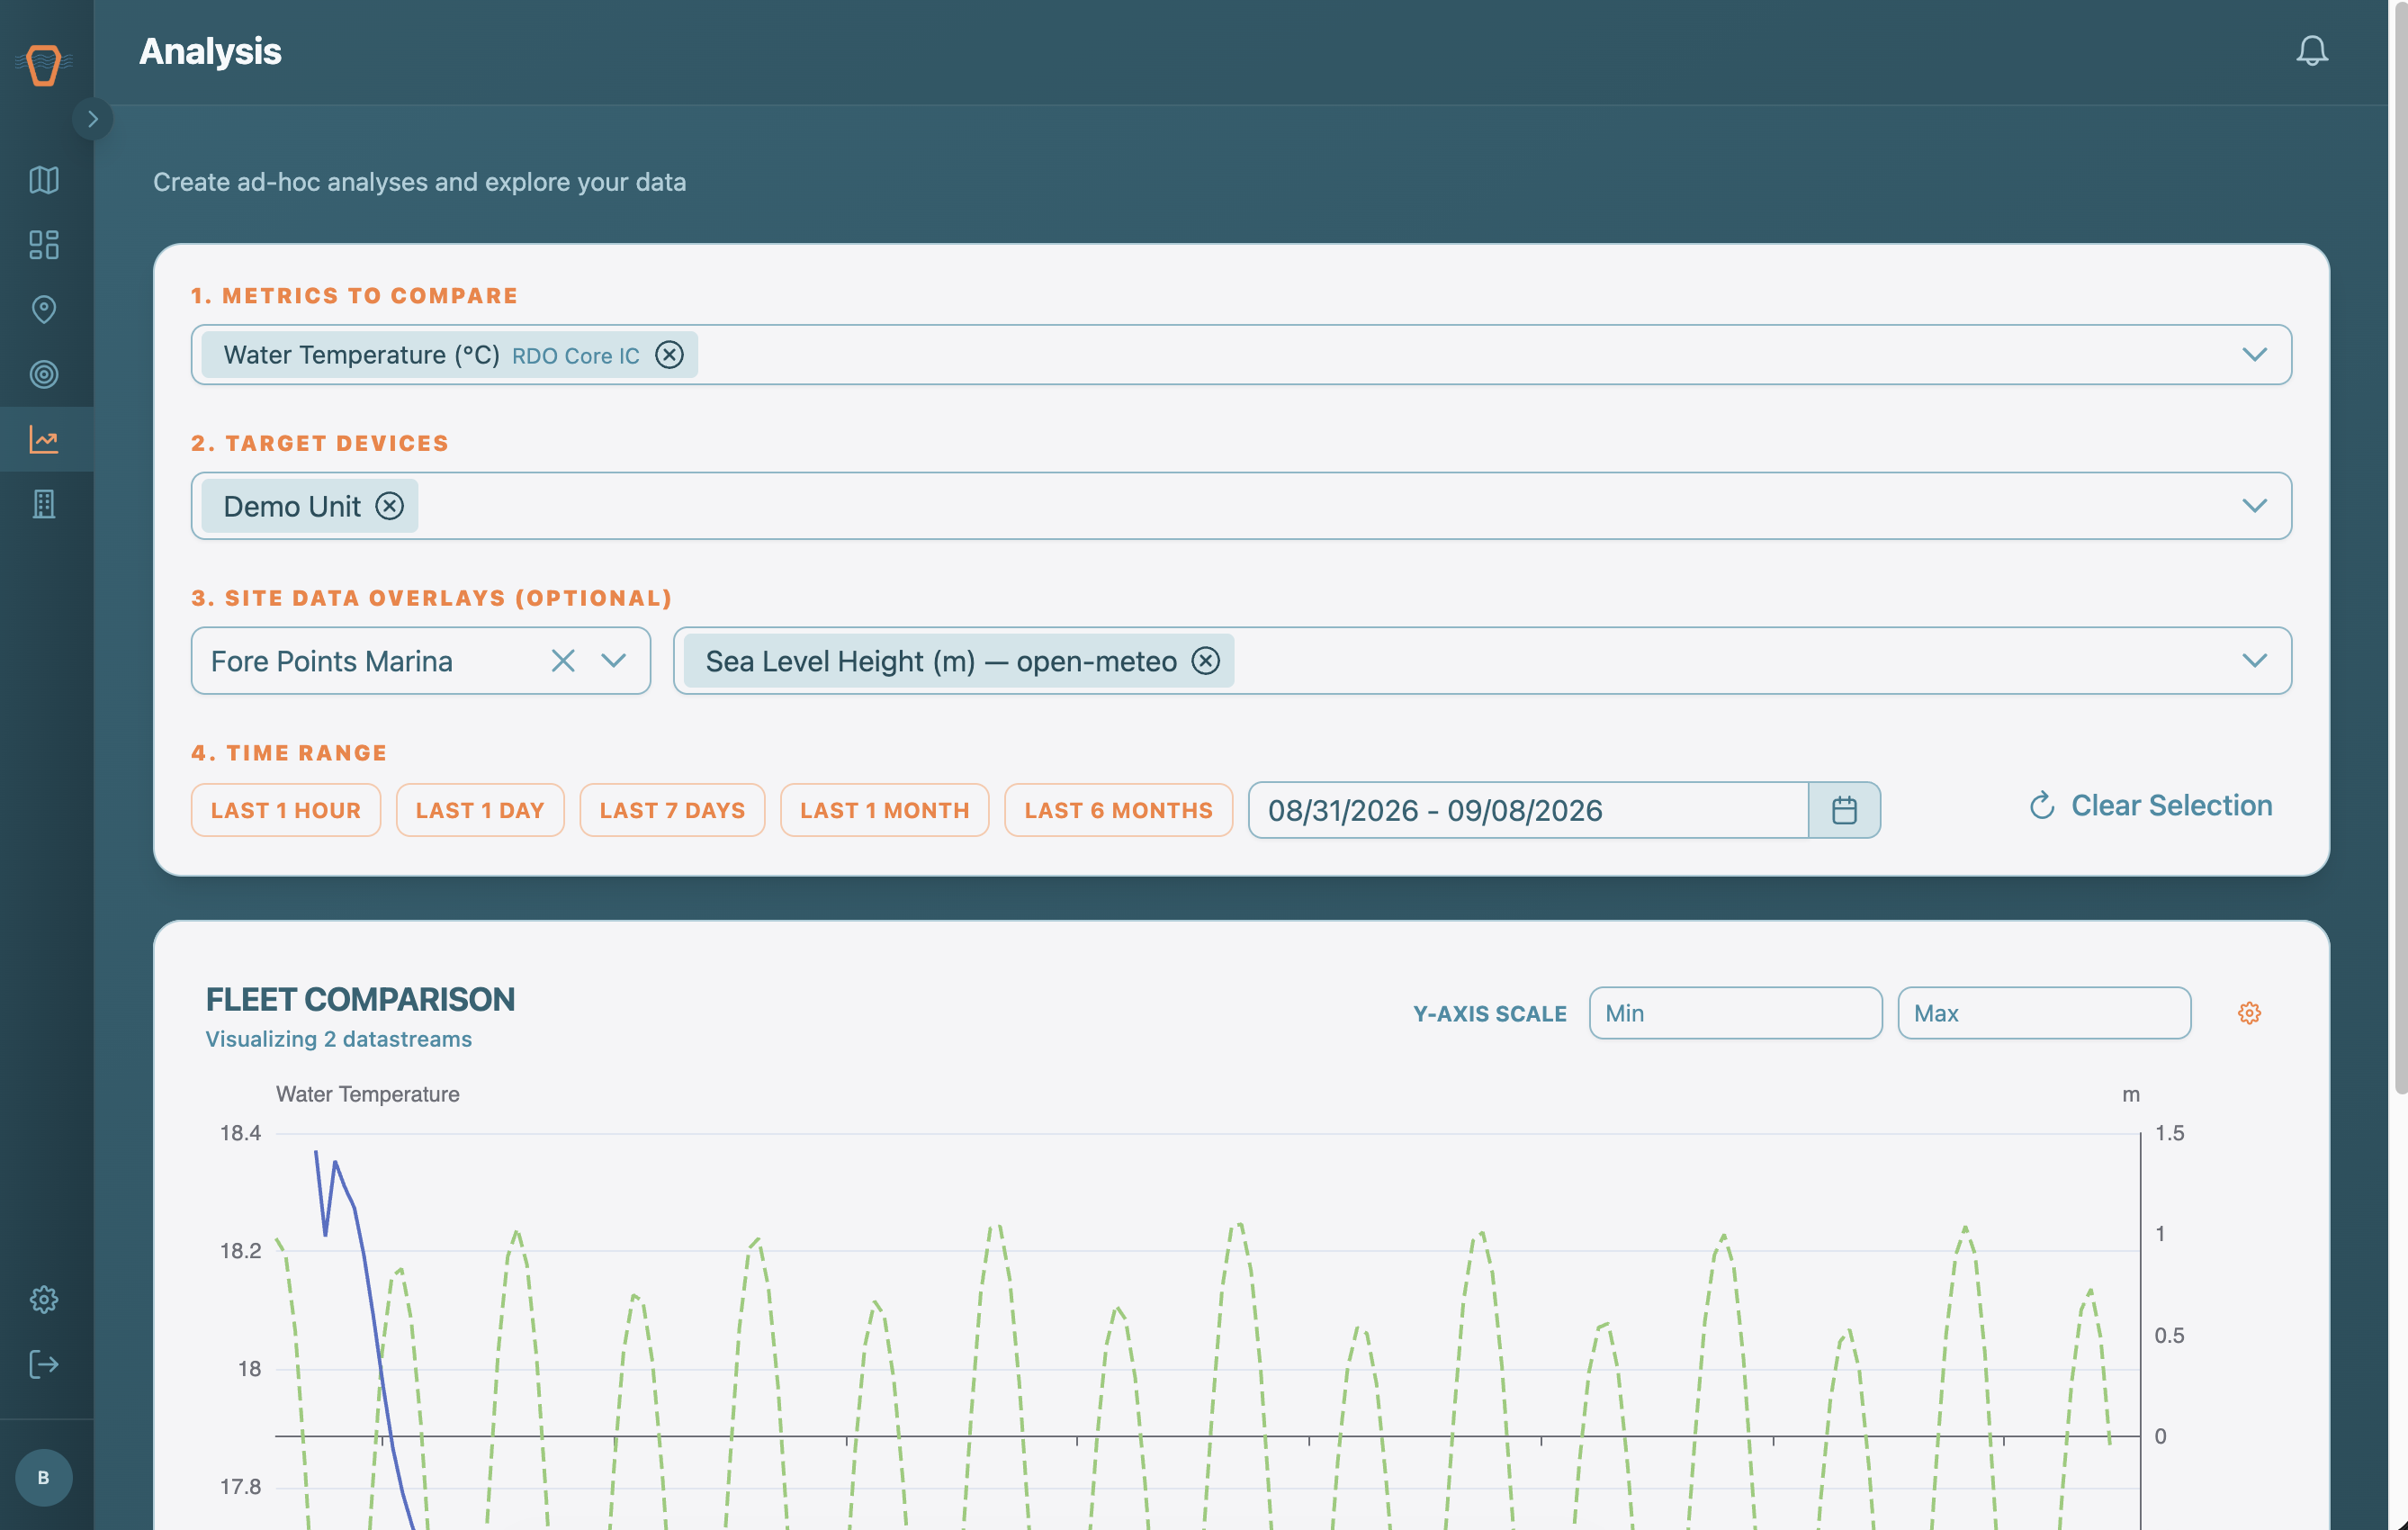
With your analysis variables selected, you will see the data from your devices and sites in the Observations Chart. You can tweak the Y-Axis and Post-Processing settings in the settings widget in the top right. For a deeper explanation on the impacts of these variables, see the Data Processing Settings guide.