Data Processing Settings
Readings charts across the Dashboard share a set of data processing controls. They let you clean up and simplify what a chart shows without changing the underlying Observations. Open them with the gear icon in the corner of any readings chart. Changes apply to that chart only.
Use 'Apply' to see your changes, and 'Reset Defaults' to return to the standard settings at any time.
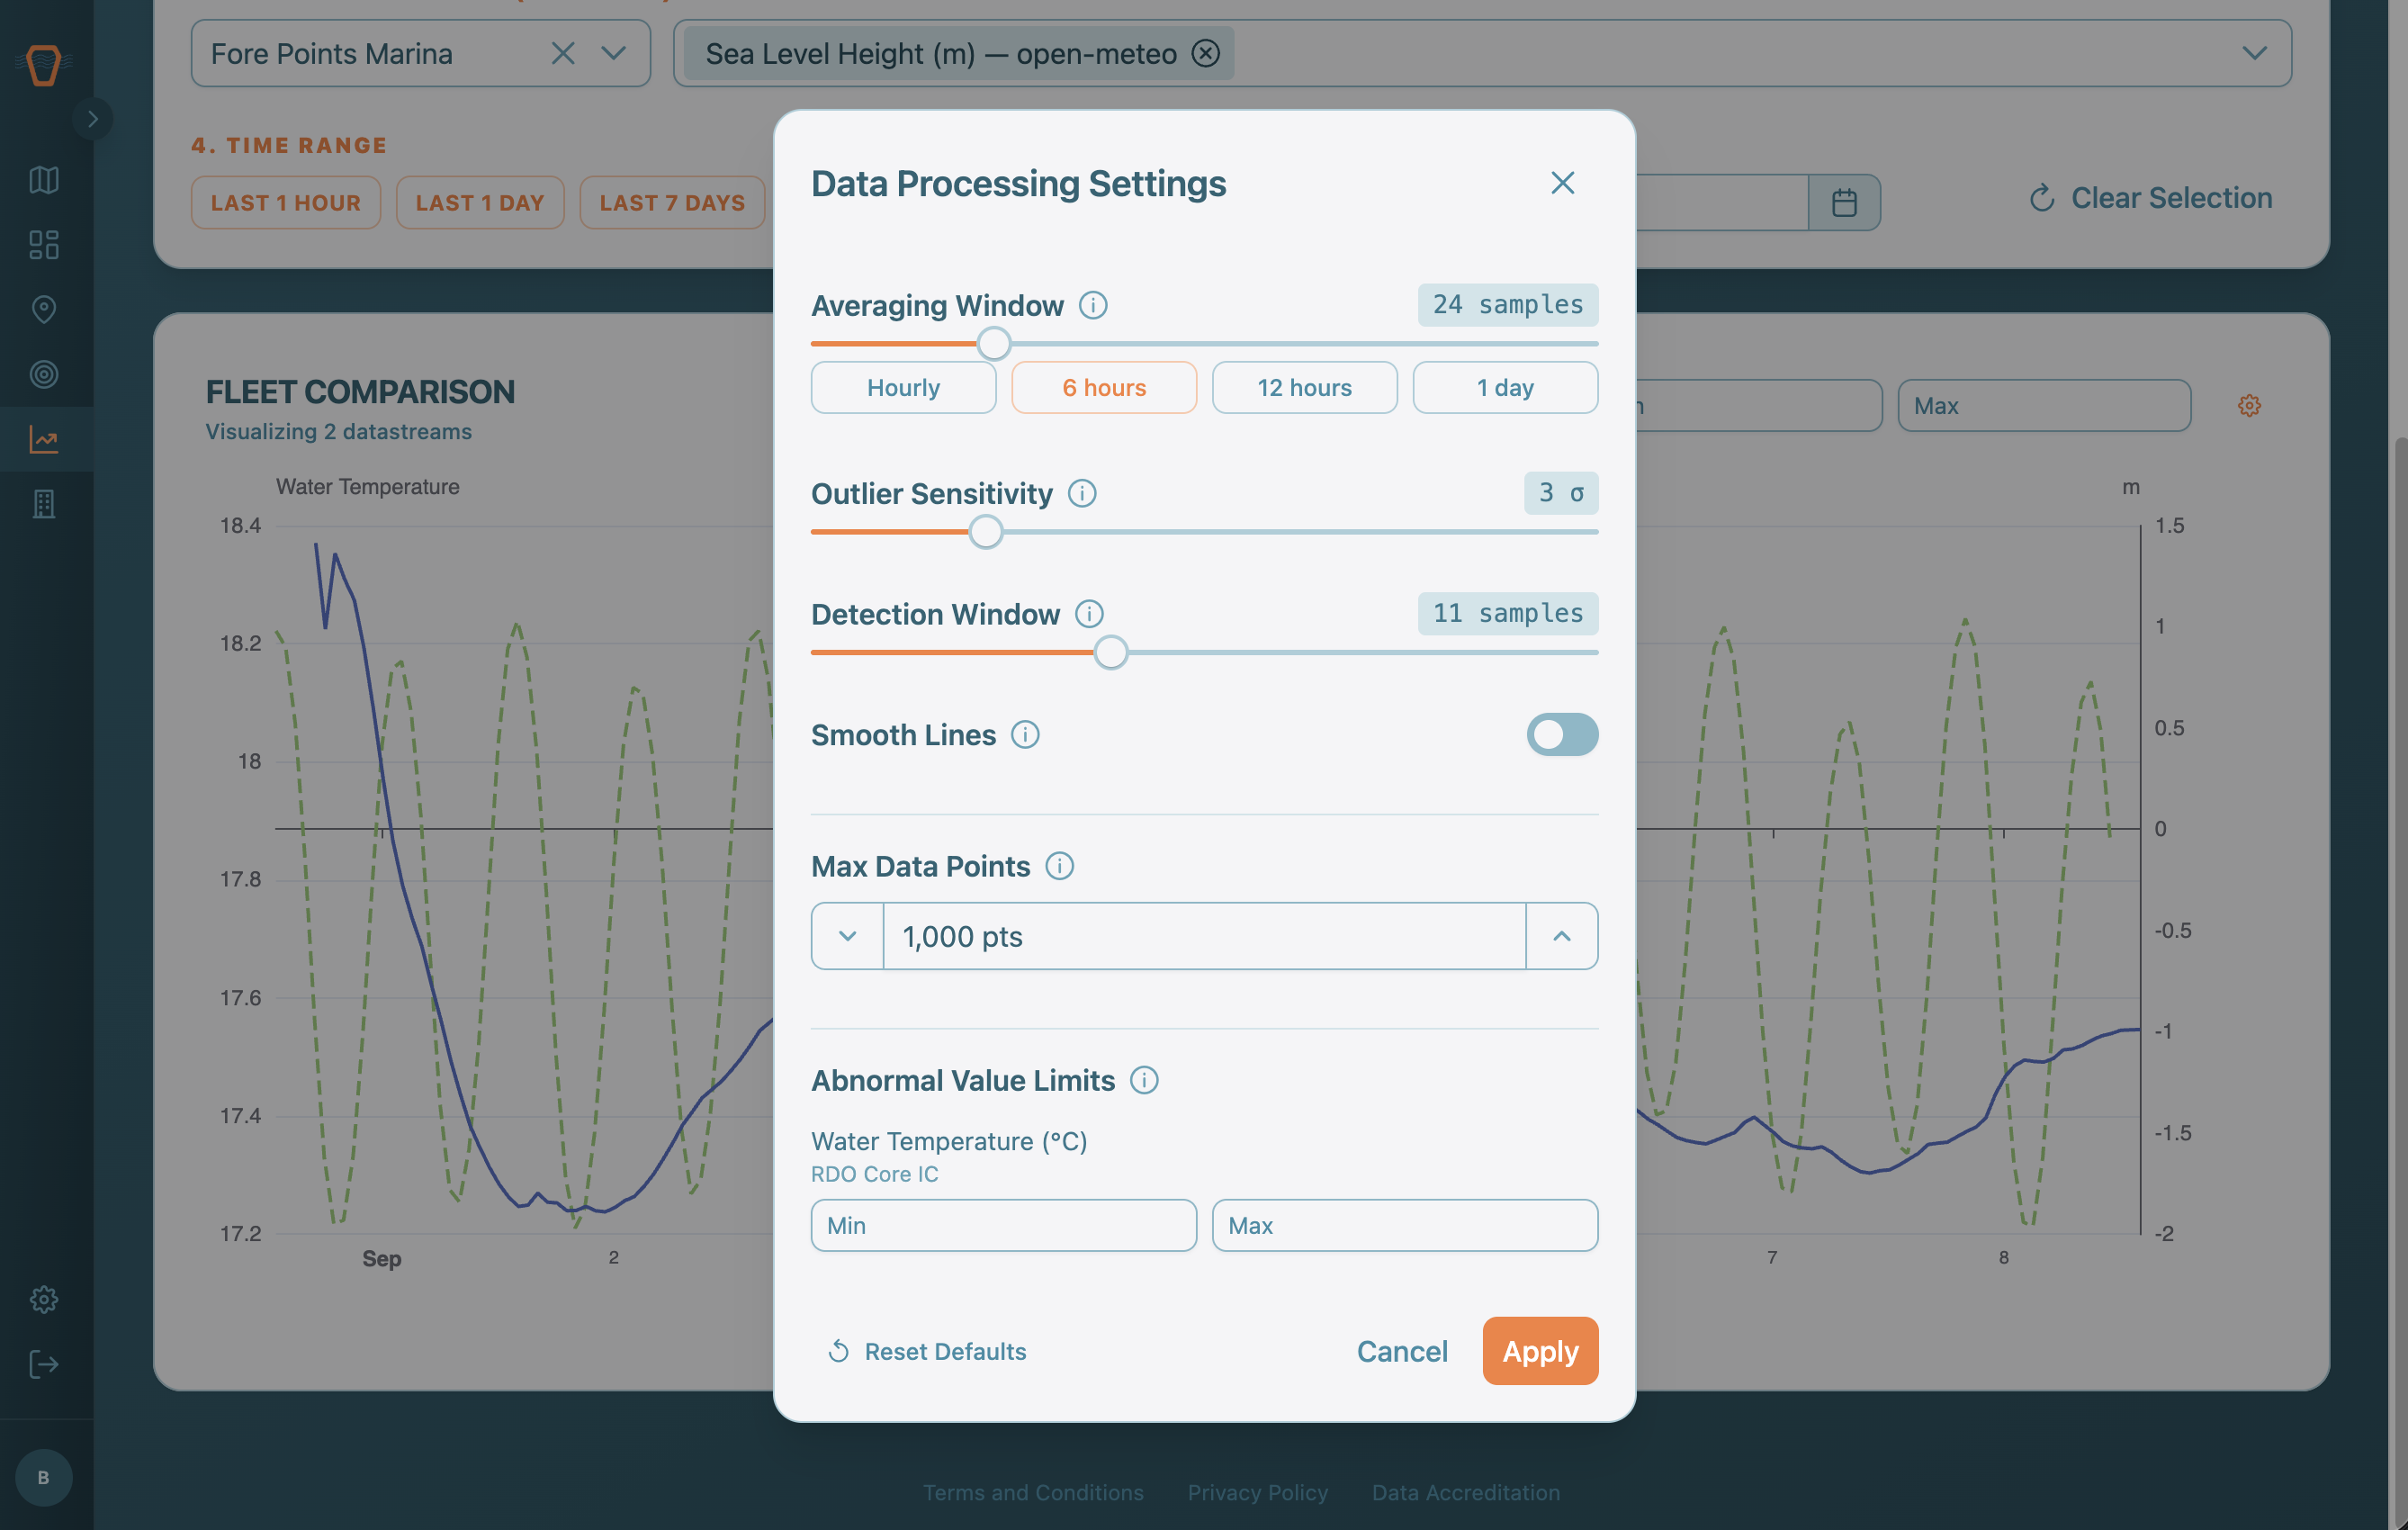
The Settings
| Setting | What it does | Range (default) |
|---|---|---|
| Averaging Window | Plots a moving average over this many data points. Higher values create smoother lines but can hide short-term spikes. | 1 to 100 samples (default 1, which means no averaging). Temporal implications depends on the device's sampling schedule. |
| Outlier Sensitivity | Removes points that deviate from the local mean by more than this many standard deviations. Lower values filter more aggressively. | 1 to 10 σ (default 3) |
| Detection Window | The number of surrounding points used to calculate the mean when detecting outliers. | 3 to 24 samples (default 11) |
| Smooth Lines | When an outlier is removed, replaces it with the window average instead of dropping the point. This gives smoother lines but introduces artificial data. | On or Off (default Off) |
| Max Data Points | Downsamples the series to keep large time ranges responsive, using LTTB downsampling. | default 1000 points |
| Abnormal Values | Filters out values outside of these thresholds such that they have no impact on any post processing | default not set |
Good to Know
These settings change only how a chart is drawn. They do not alter the raw Observations stored on your Devices, and they do not affect the data you export from the readings table. Each chart remembers its own settings, so you can tune one property without affecting the others.