Device Detail
This page is the full picture of a single Device: its current health, the Sensors it carries, its history, and the Deployments it belongs to.
Device Information
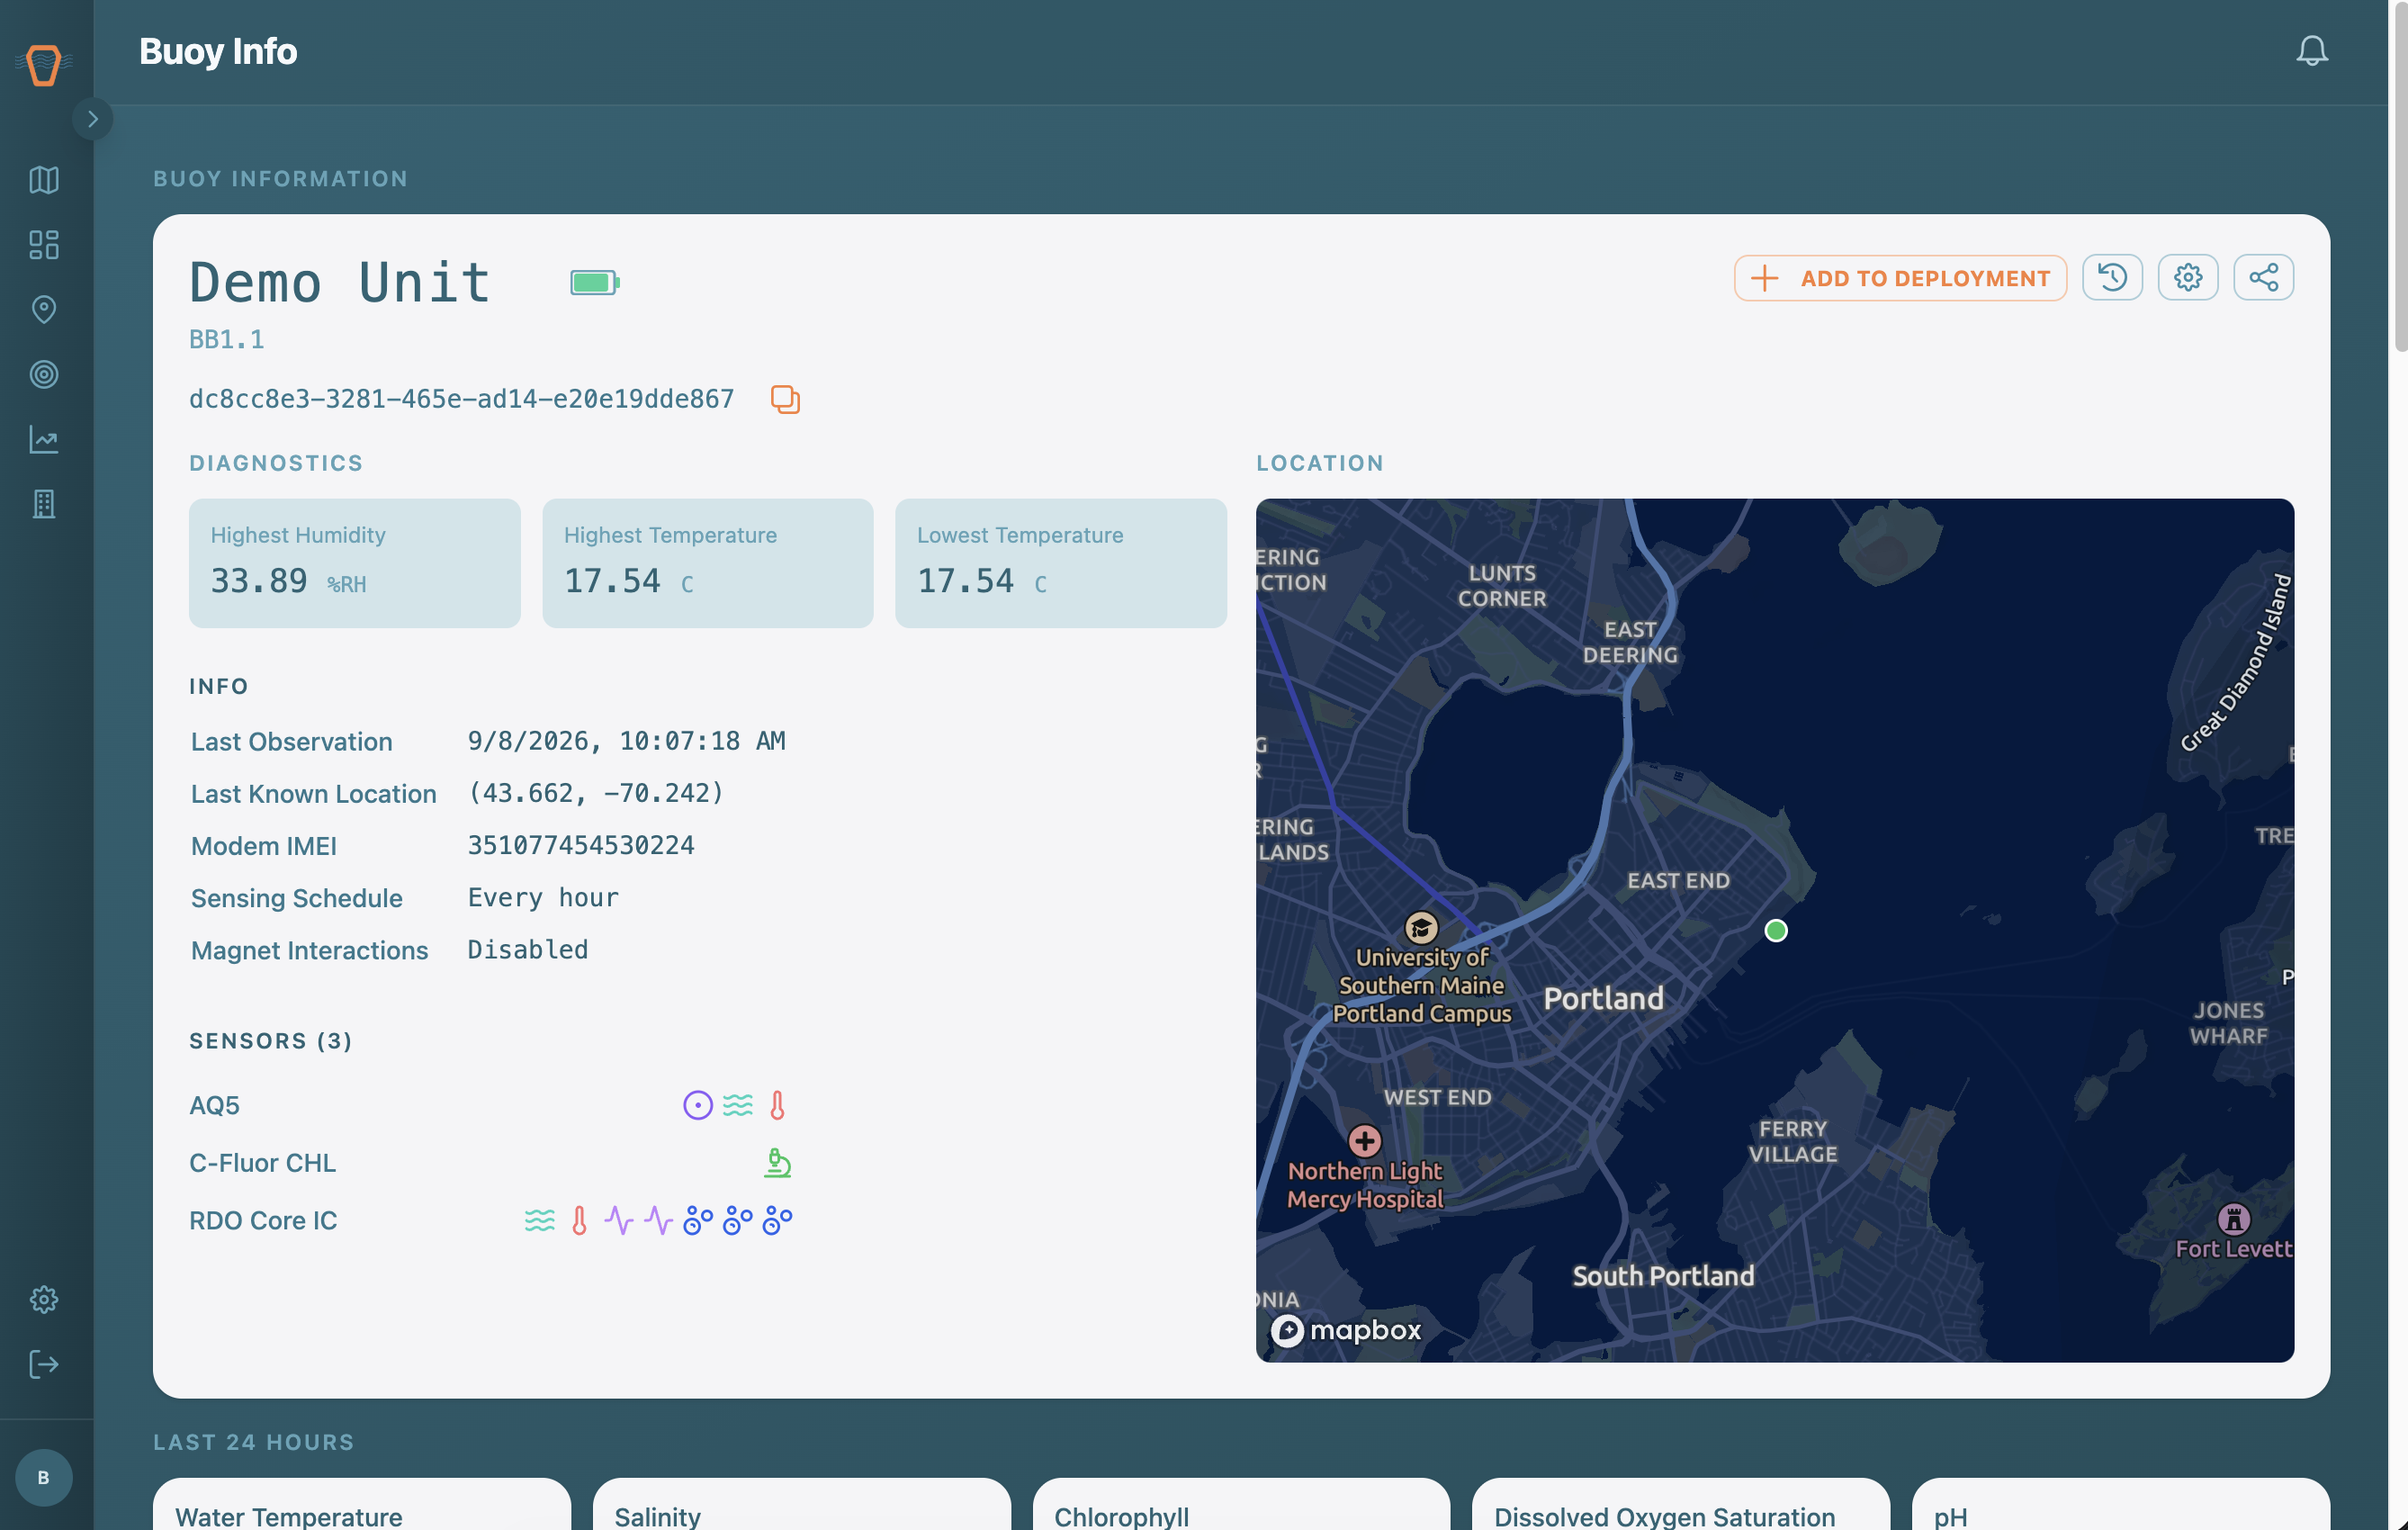
The information card at the top of the page is your quick health check for the Device. Its header shows the Device name, serial number, and copyable ID, plus battery and power indicators and any status reasons that explain the current state. Below the header you will see a
- diagnostics area with humidity and temperature
- last known location
- modem
- sensing schedule
- magnet interaction status
- the list of Sensors the Device carries
- a small map of its last known location.
The card is also where you manage the Device. If you are an Organization Admin, you can rename the Device inline, open its Settings to adjust the sensing schedule that controls how often the Device records Observations, and Share it with another organization. The event timeline button opens the Device's status history, which is a log of all Device Status changes throughout the Device lifetime.
Recent and Historical Readings
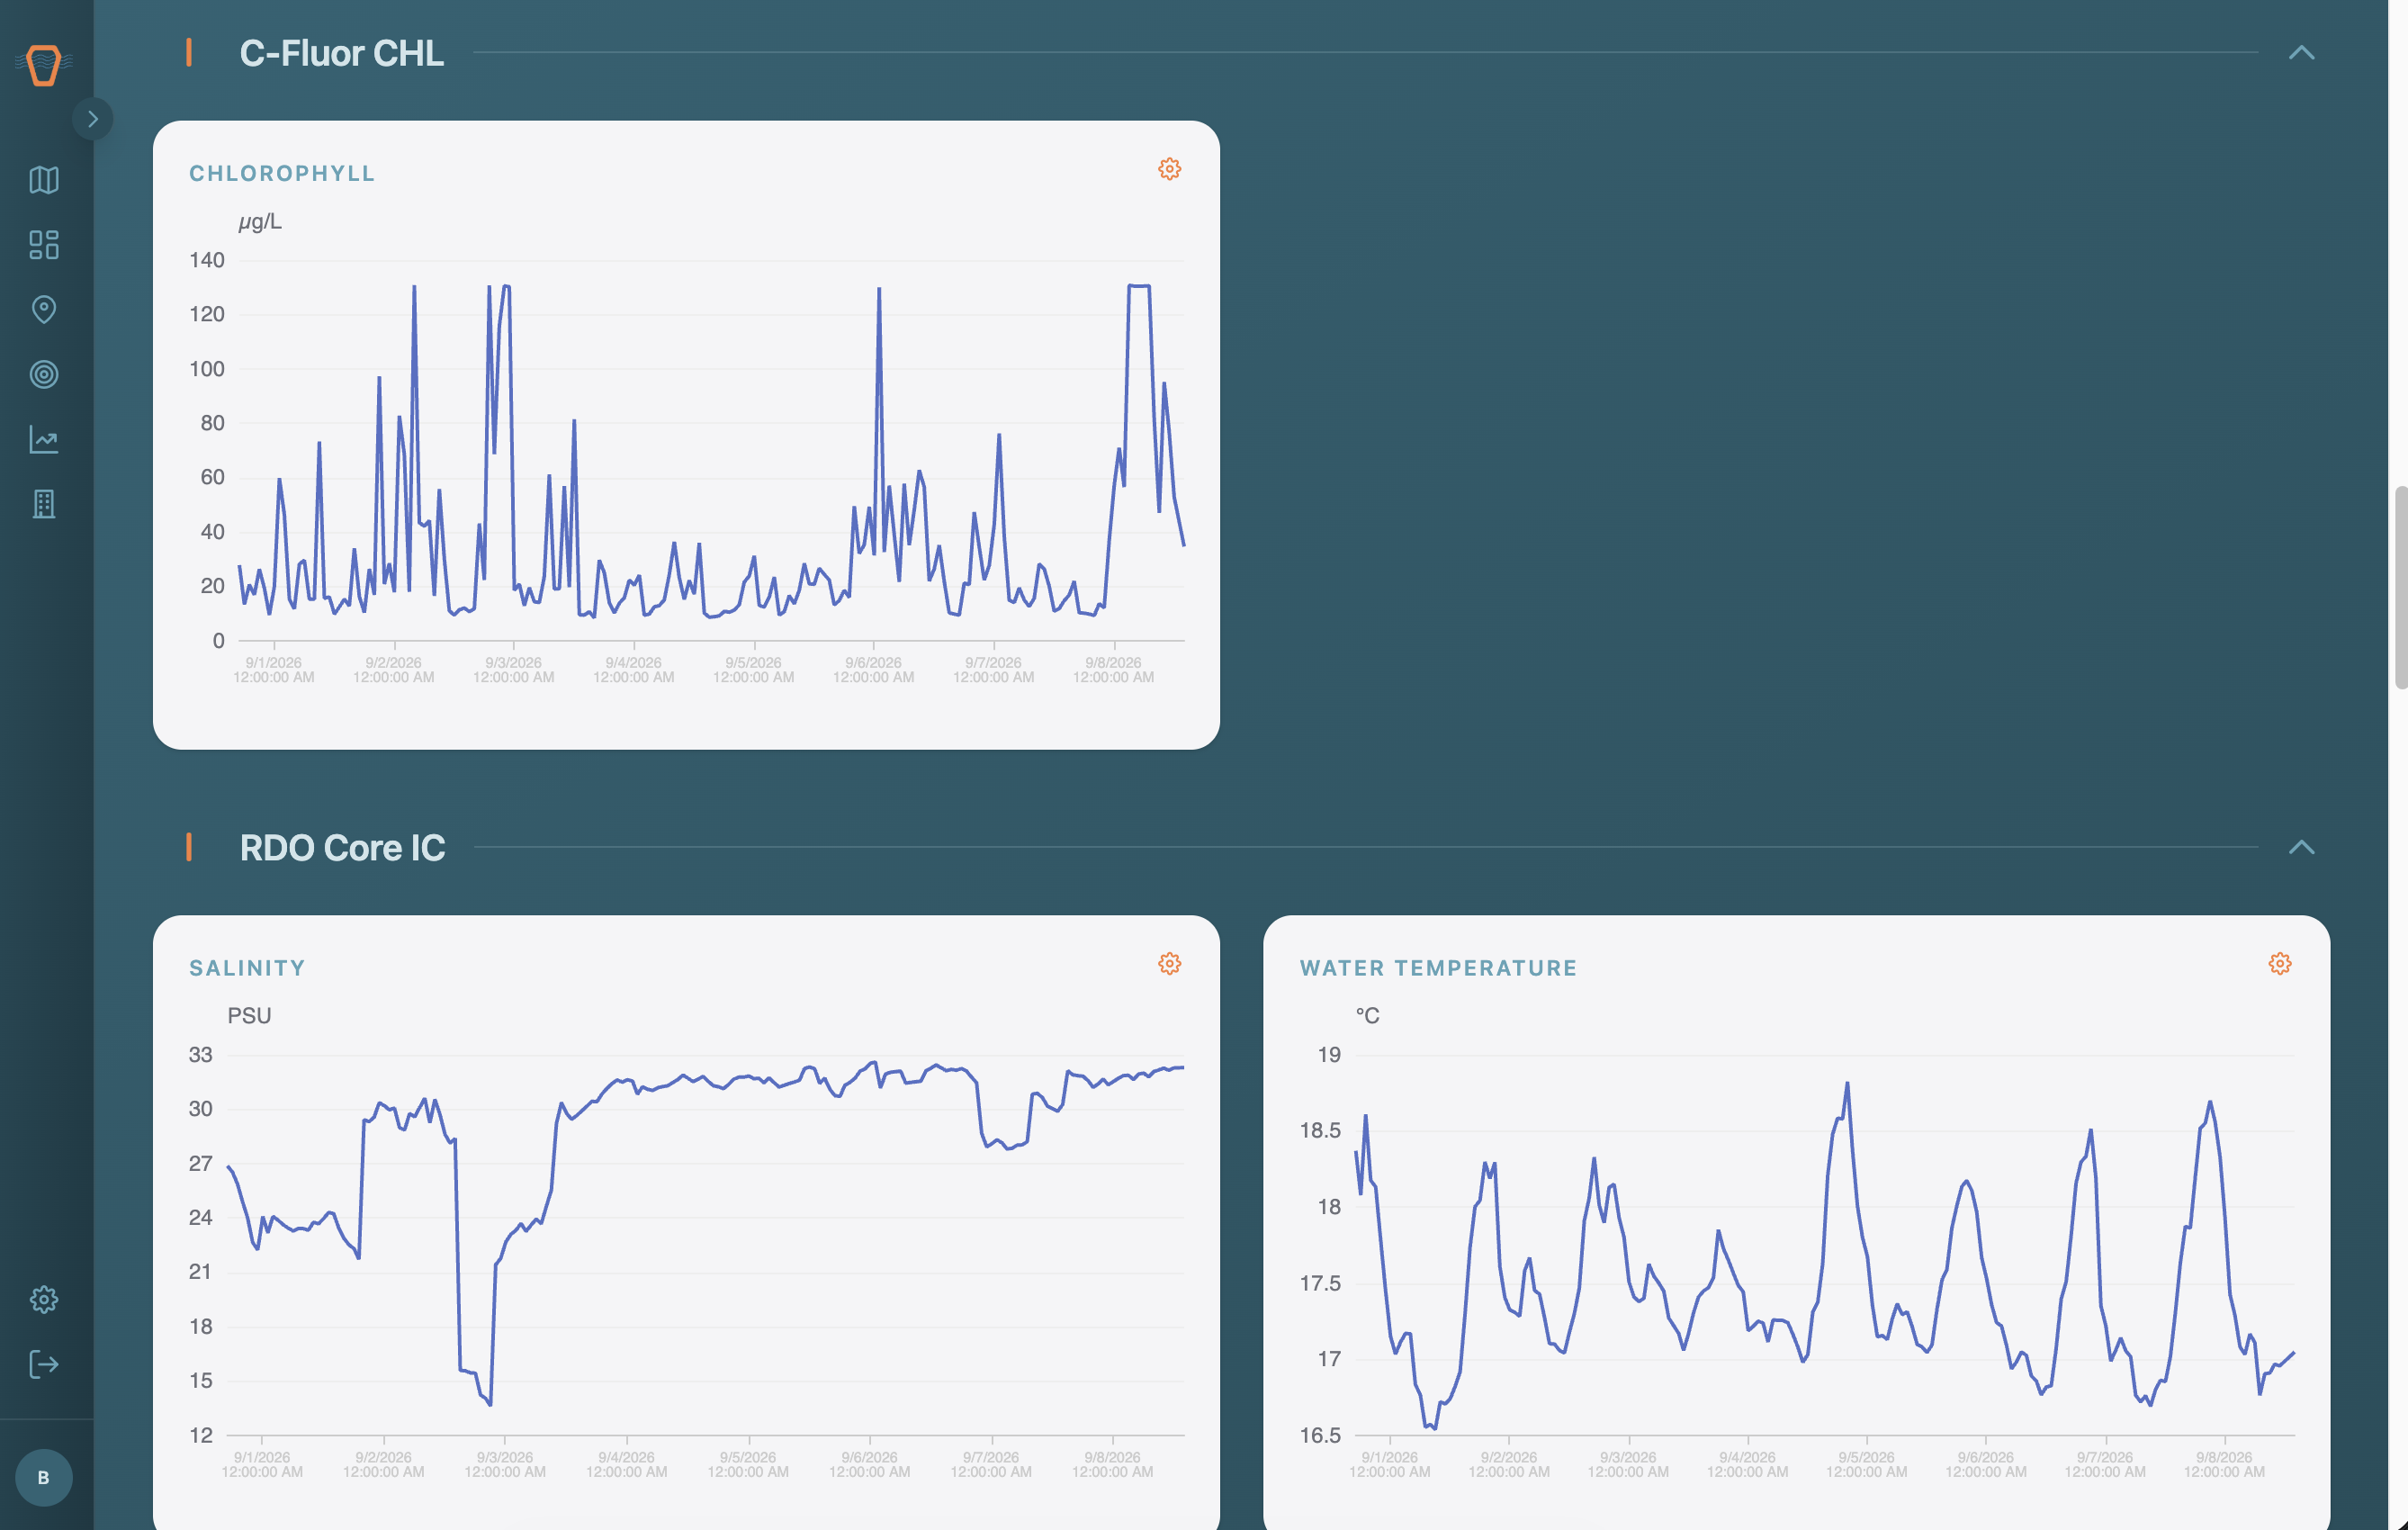
The 'Last 24 Hours' row shows a quick sparkline and the latest, minimum, average, and maximum for each key Observed Property. To look further back, set a window with the date range selector. The charts below plot each Observed Property over that window, with the same processing and threshold options found elsewhere.
![]
Readings Table and Export
The readings table lists every Observation in your selected range, with a column per Observed Property. Use the Download button to export that range as a file for your own analysis.
Deployments
At the bottom, a table shows the Deployments this Device is part of, with links to each Deployment and its Site.