Device Statuses and Icons
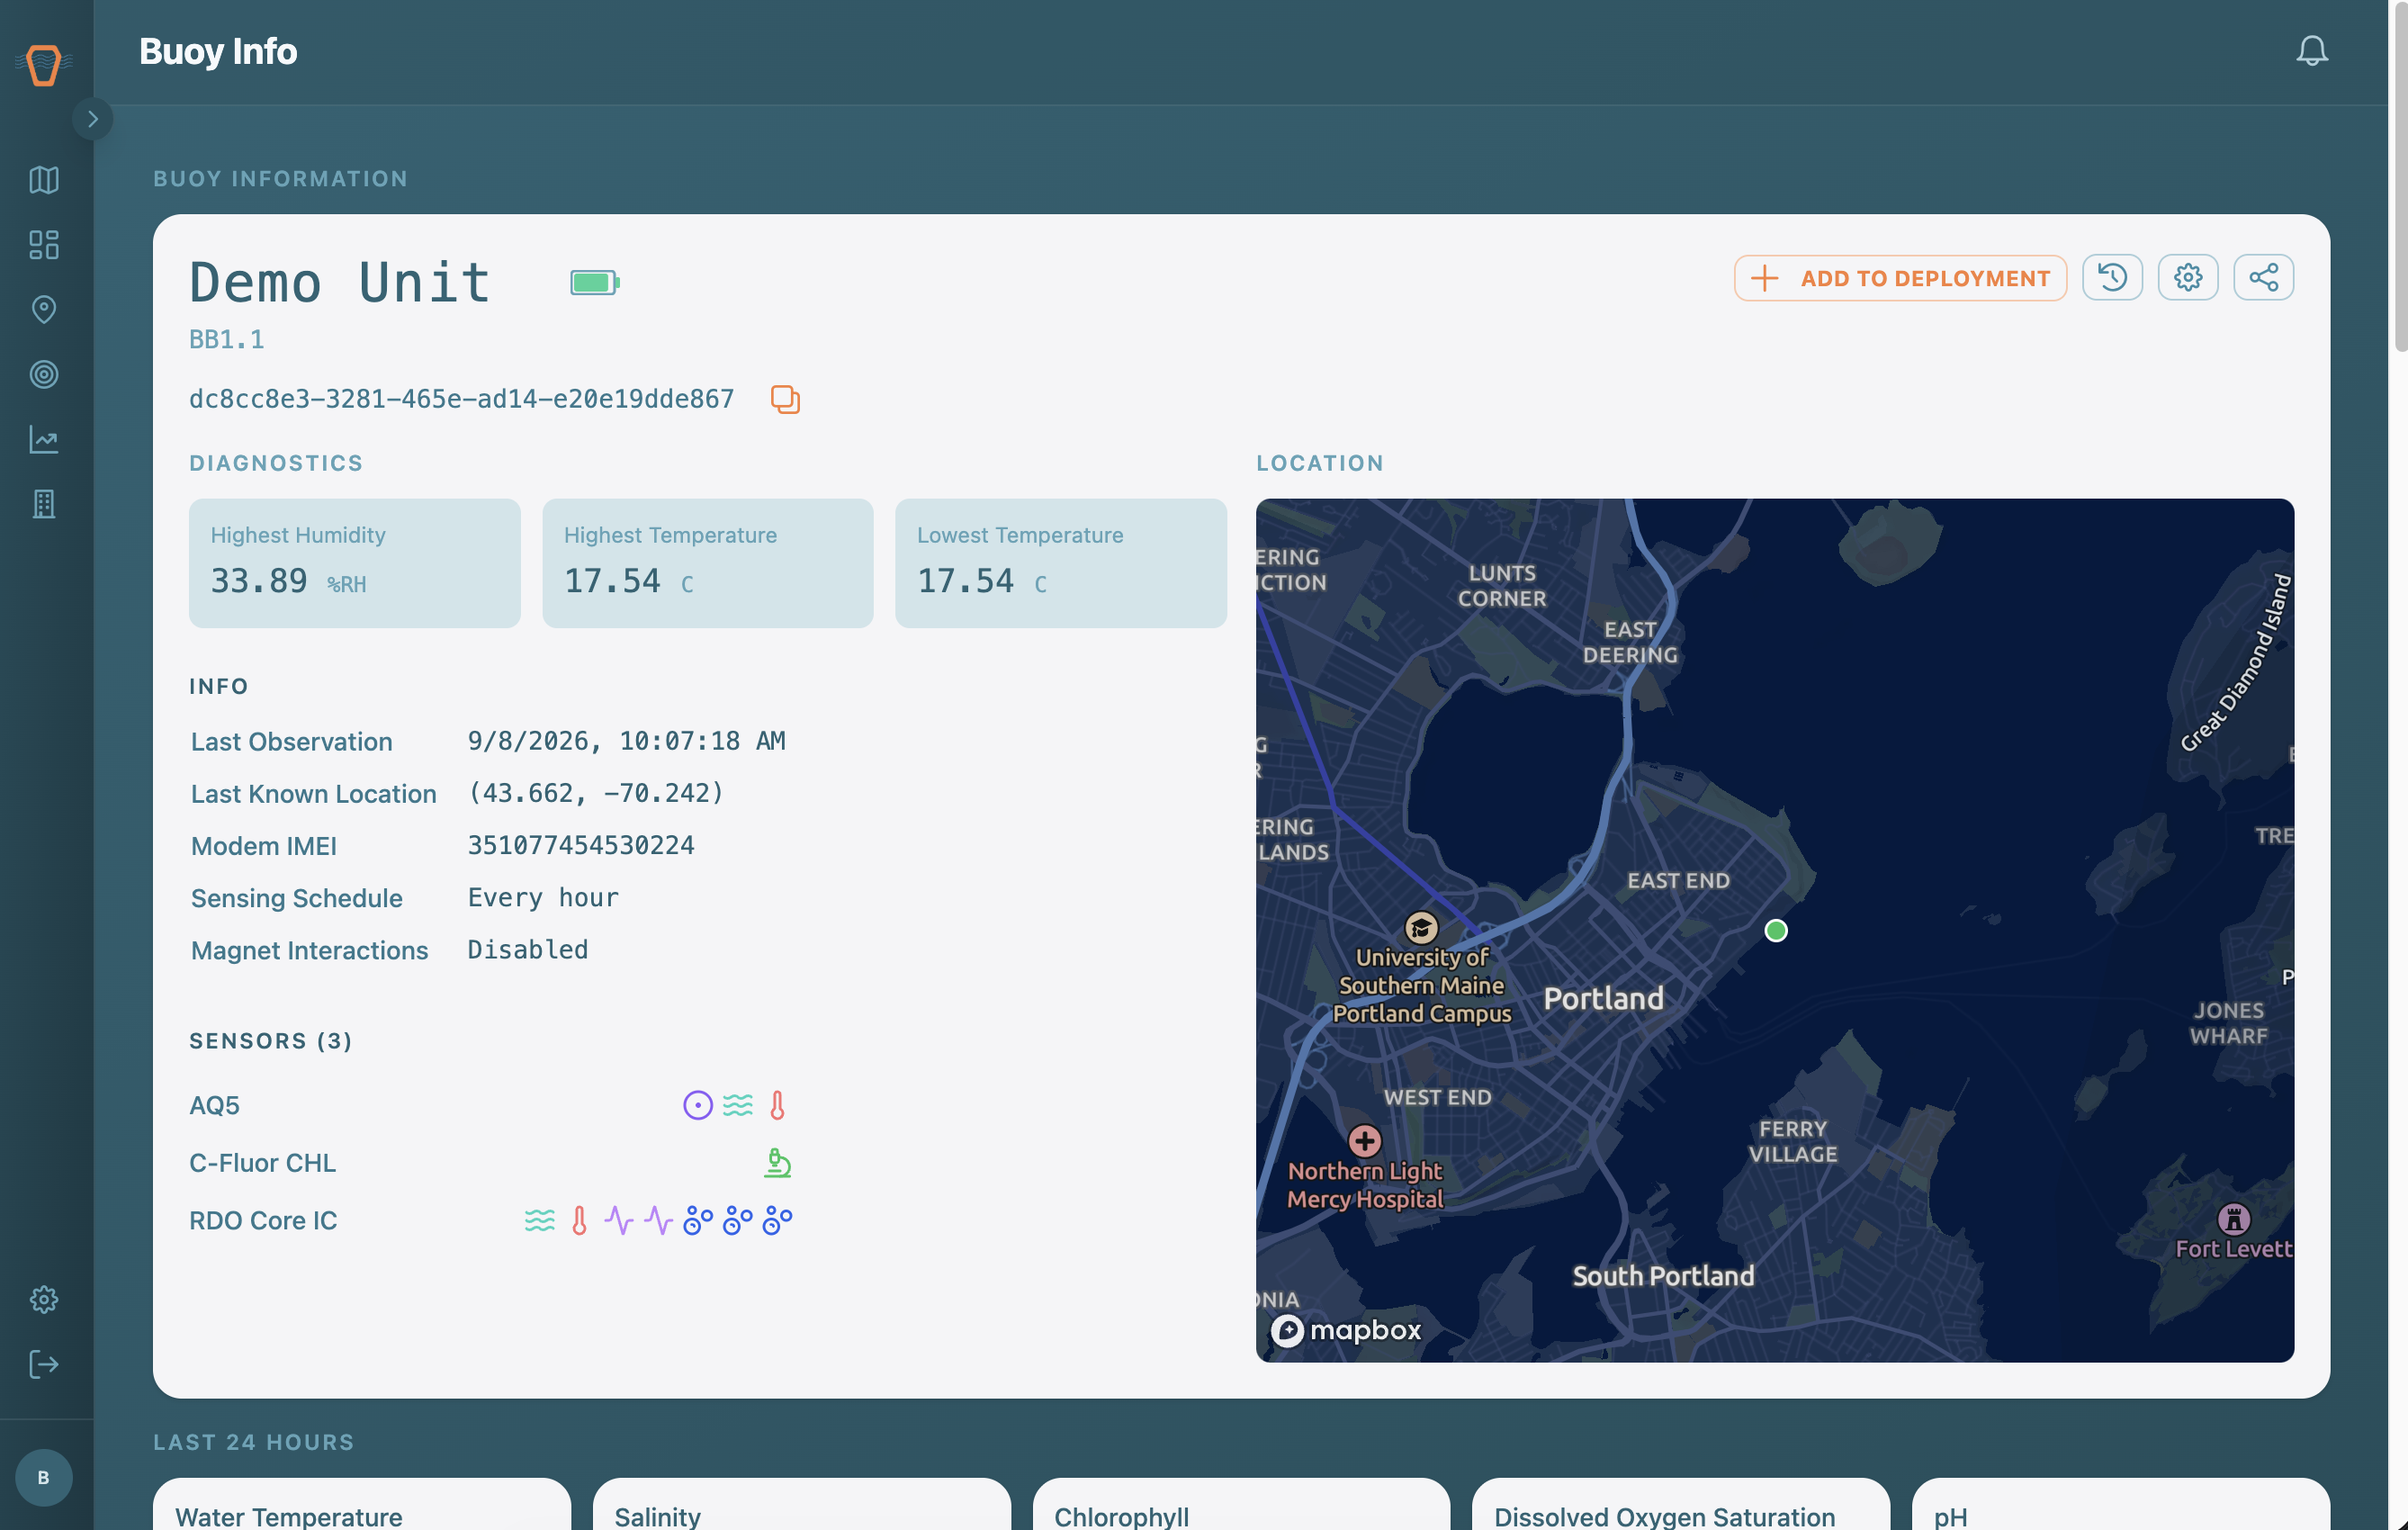
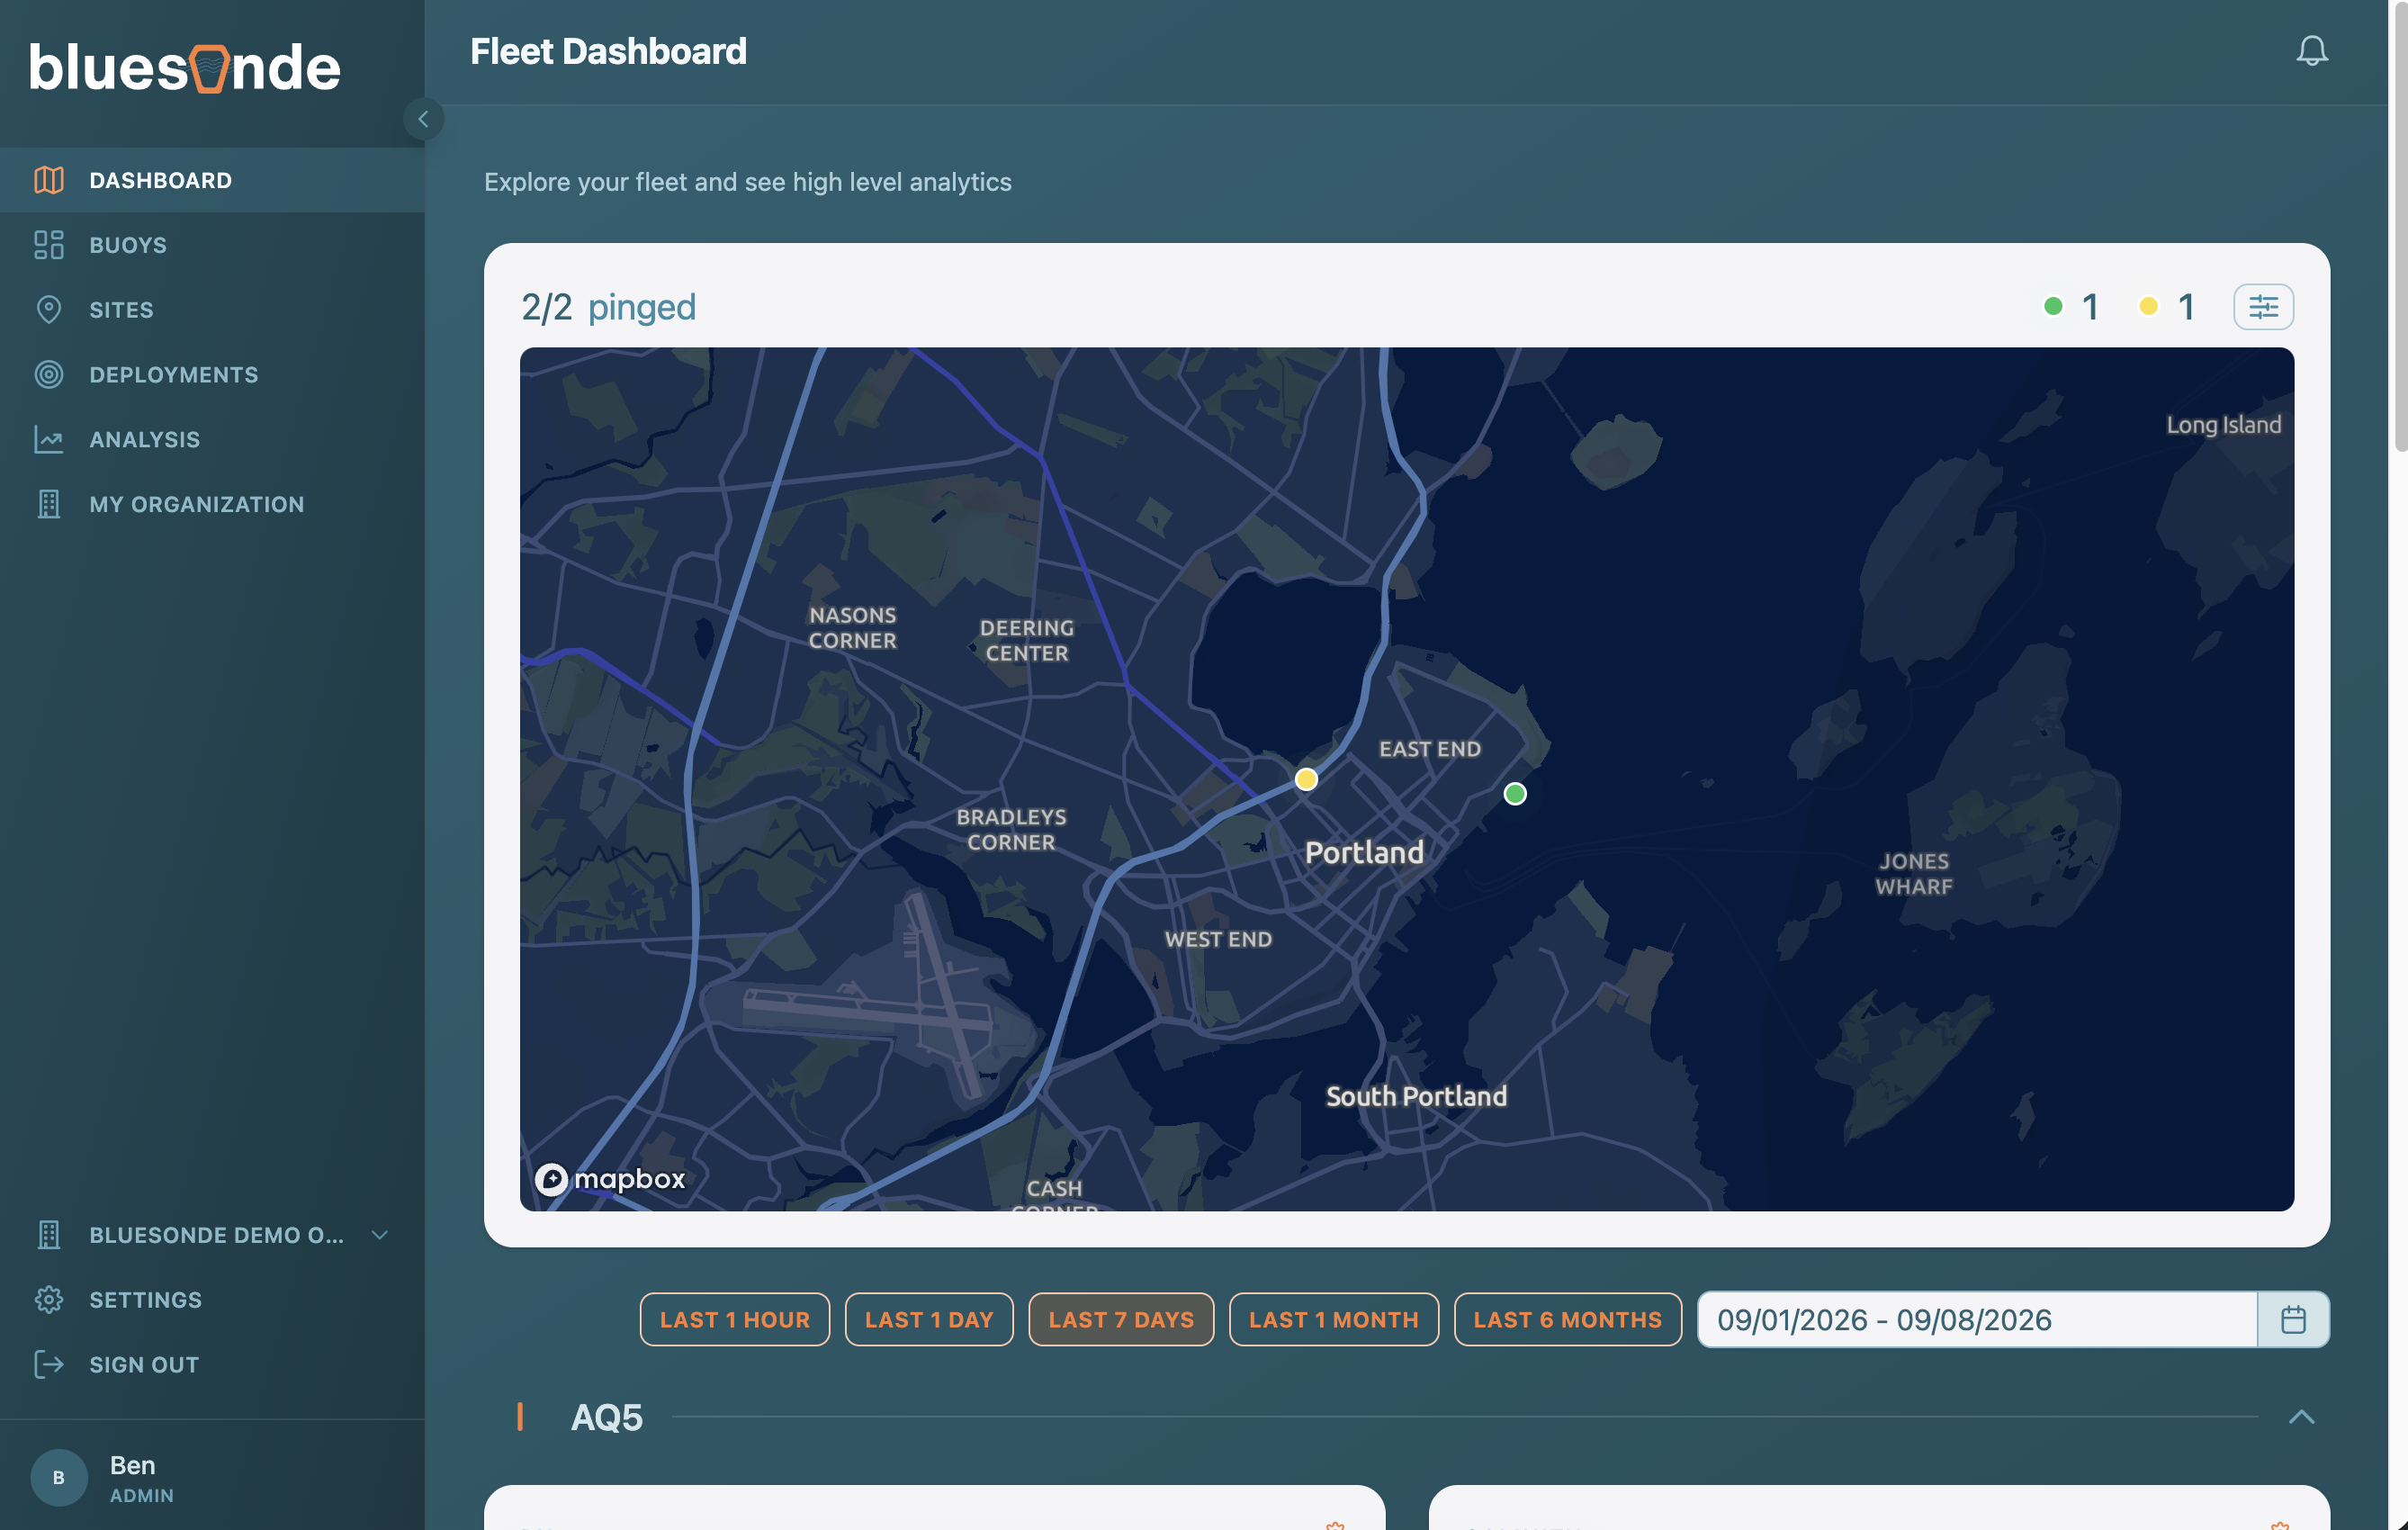
Every Device has an overall status that summarizes its health at a glance. You will see it as a colored marker on the fleet map, and as a pill on Device cards and Device pages. When a Device needs attention, one or more status reasons explain why, each shown as a small icon you can hover for a label.
Status Levels
A Device's status rolls up its recent readings and diagnostics into a single level.
| Status | Color | Meaning |
|---|---|---|
| Healthy | Green | The Device is reporting normally and no issues were detected. |
| Warning | Yellow | The Device is reporting, but a reading or diagnostic needs attention. |
| Critical | Red | A serious issue was detected and needs prompt attention. |
| Offline | Red | The Device has not reported recently. |
| Diagnostic Unavailable | Grey | There is not enough diagnostic data to judge the Device's health yet. Also shown as Unknown. |
| Deactivated | Grey | The Device has been switched off in the Dashboard and is not expected to report. |
The fleet map header on the Dashboard tallies how many Devices fall into each level, giving you a quick health summary of your whole fleet.
Status Reasons
When a Device is in a Warning or Critical state, its page and its map popup show the specific reasons behind that status. Each reason has an icon, and its color echoes the severity (red for critical concerns, amber for warnings). Hover over an icon to see its label.
| Reason | Meaning |
|---|---|
| Low Voltage | The battery voltage is low. |
| High Current | The Device is drawing more current than expected. |
| High Humidity | Humidity inside the enclosure is high. Monitor the enclosure for leaks. |
| High Enclosure Temperature | The enclosure is warmer than expected. |
| Low Enclosure Temperature | The enclosure is colder than expected. |
| Out of Water | The Device appears to be out of the water. |
| Offline | The Device has not reported recently. |