Deployment Detail
This page brings together everything about one Deployment: Devices, Observations, Sites, Alerts, and the tools to analyze them.
Deployment Information
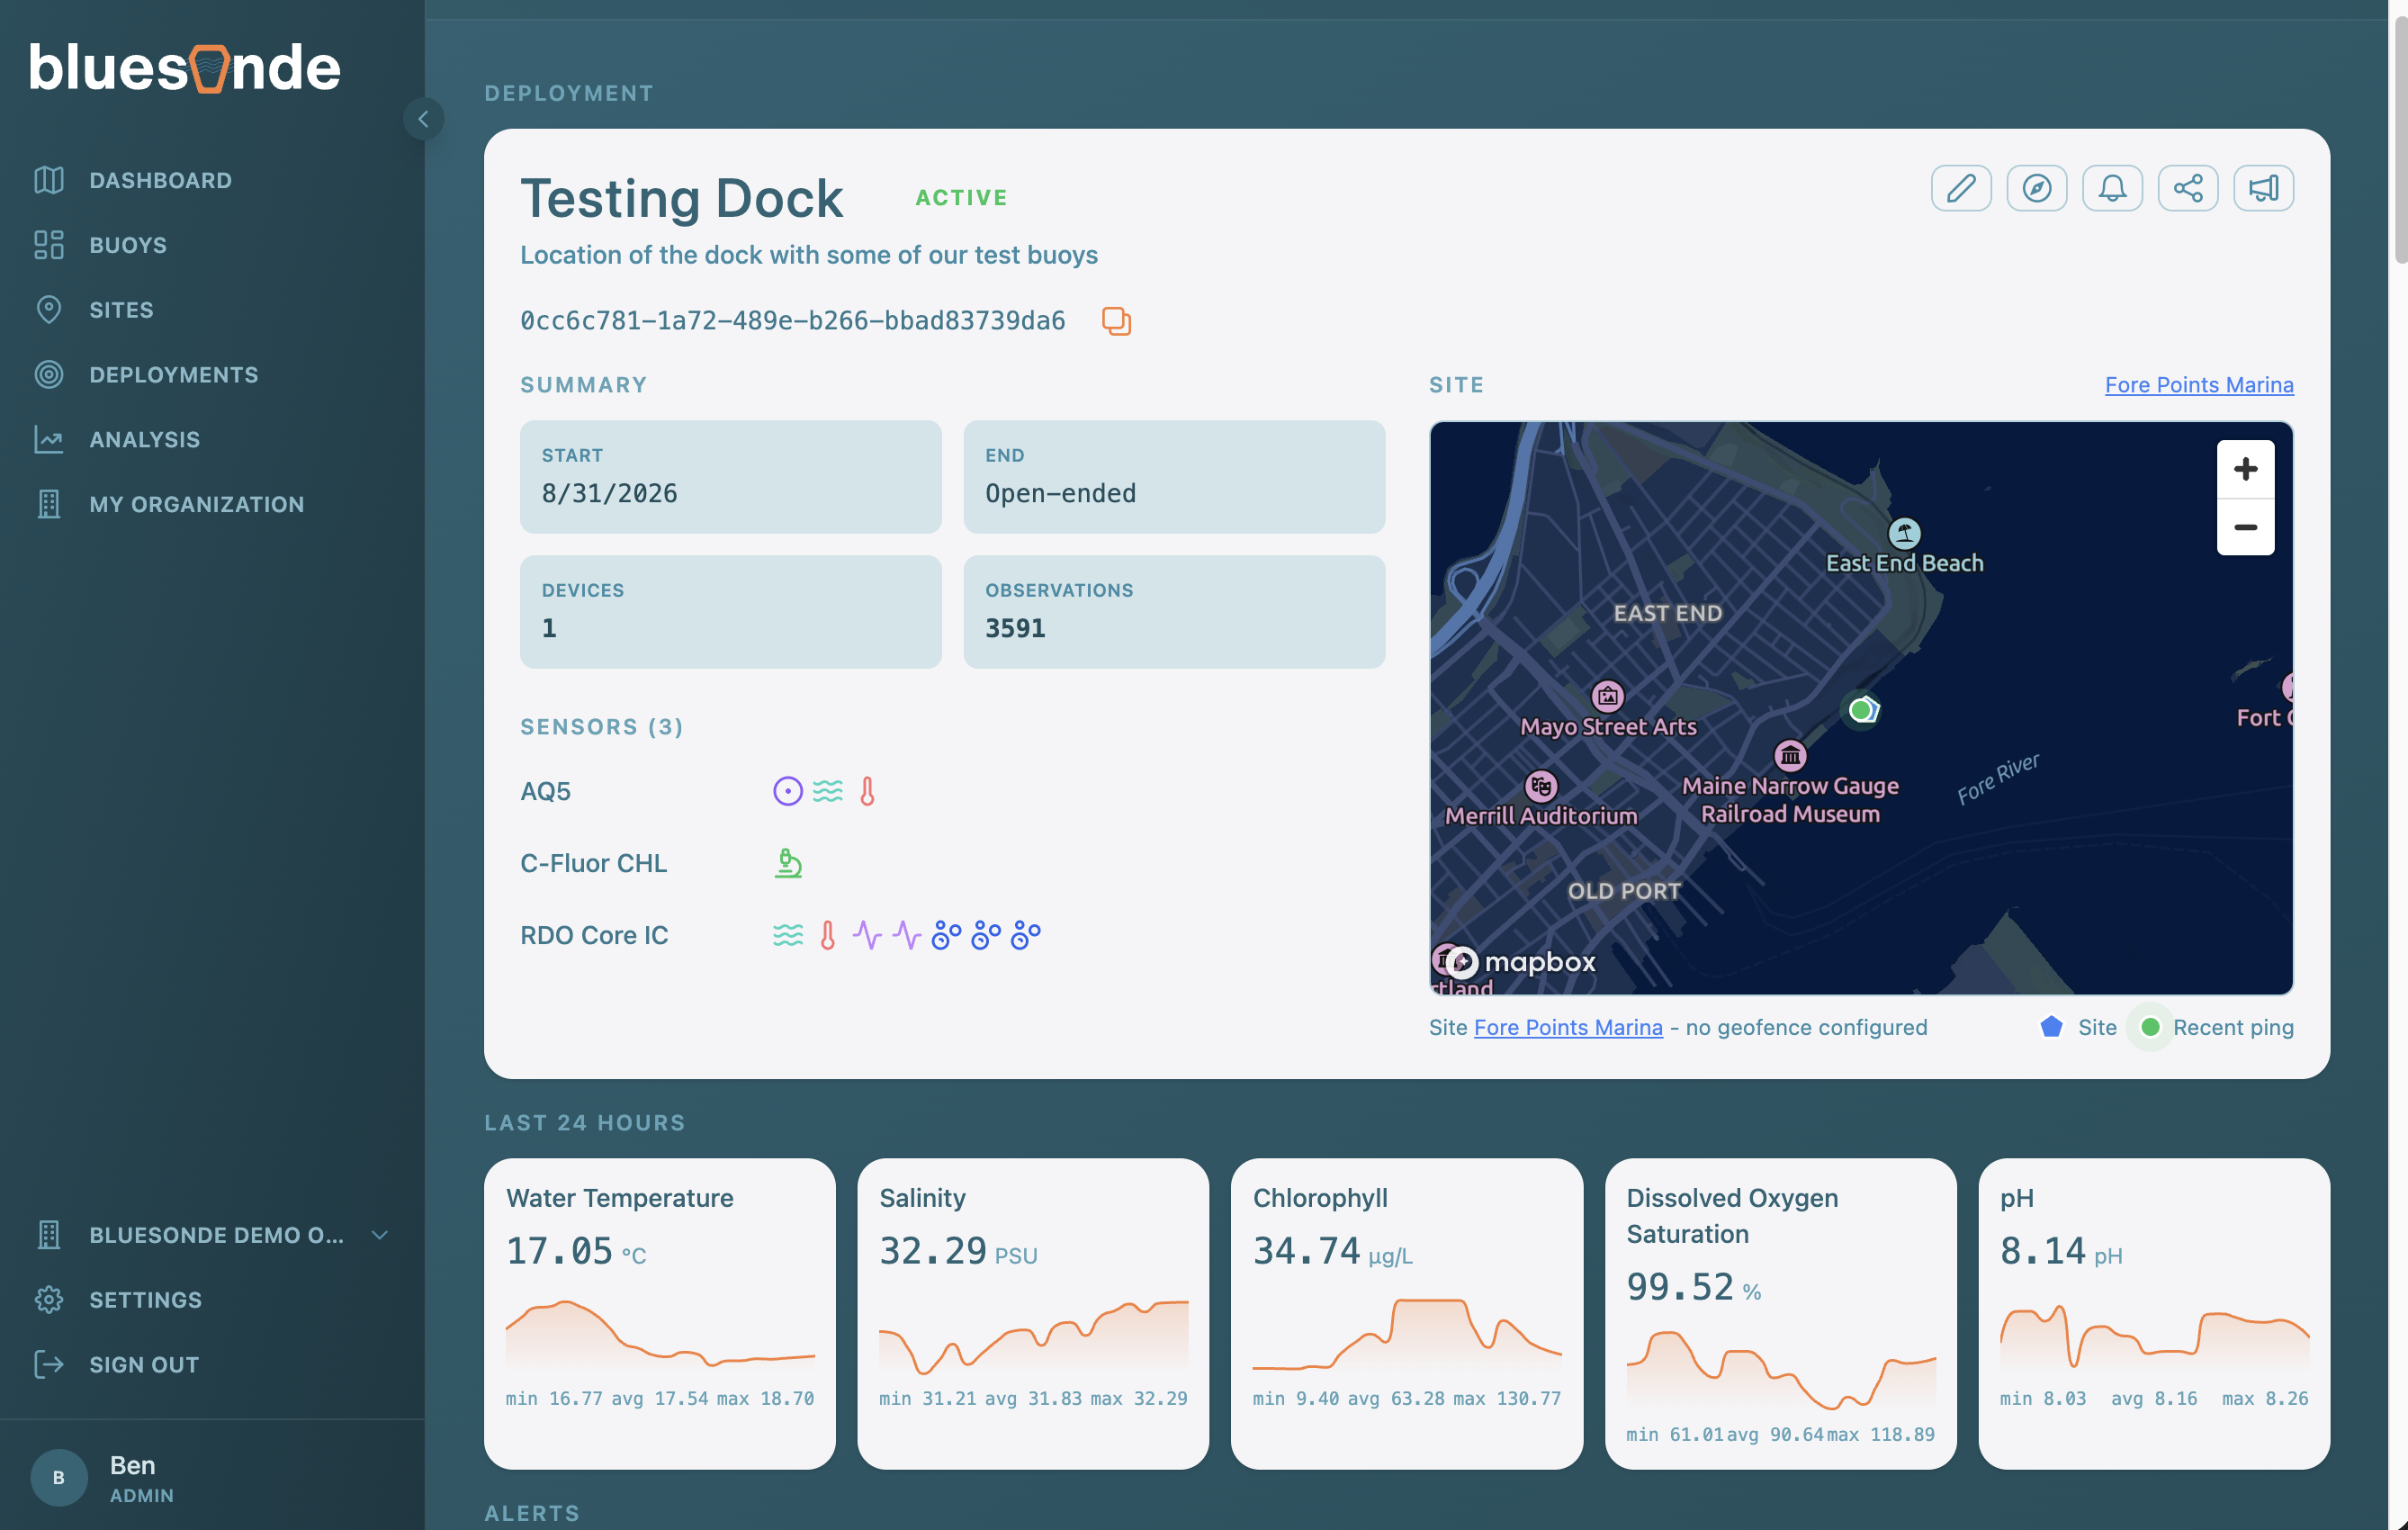
The information card at the top summarizes the Deployment. It shows the name, a status tag, the description, and a copyable ID, along with summary tiles for the start and end times and the totals of Devices and Observations. A map plots the Site anchor and the current location of each attached Device, colored by status.
The card is also your control panel for the Deployment. Organization Admins can edit the Deployment's details, and can open the Geofence and Alert Rules settings to configure monitoring, which is covered in the next section. A Share button gives another organization access. The notifications button, available to any member, lets you subscribe yourself to Email or SMS alerts.
Monitoring with Geofences and Alert Rules
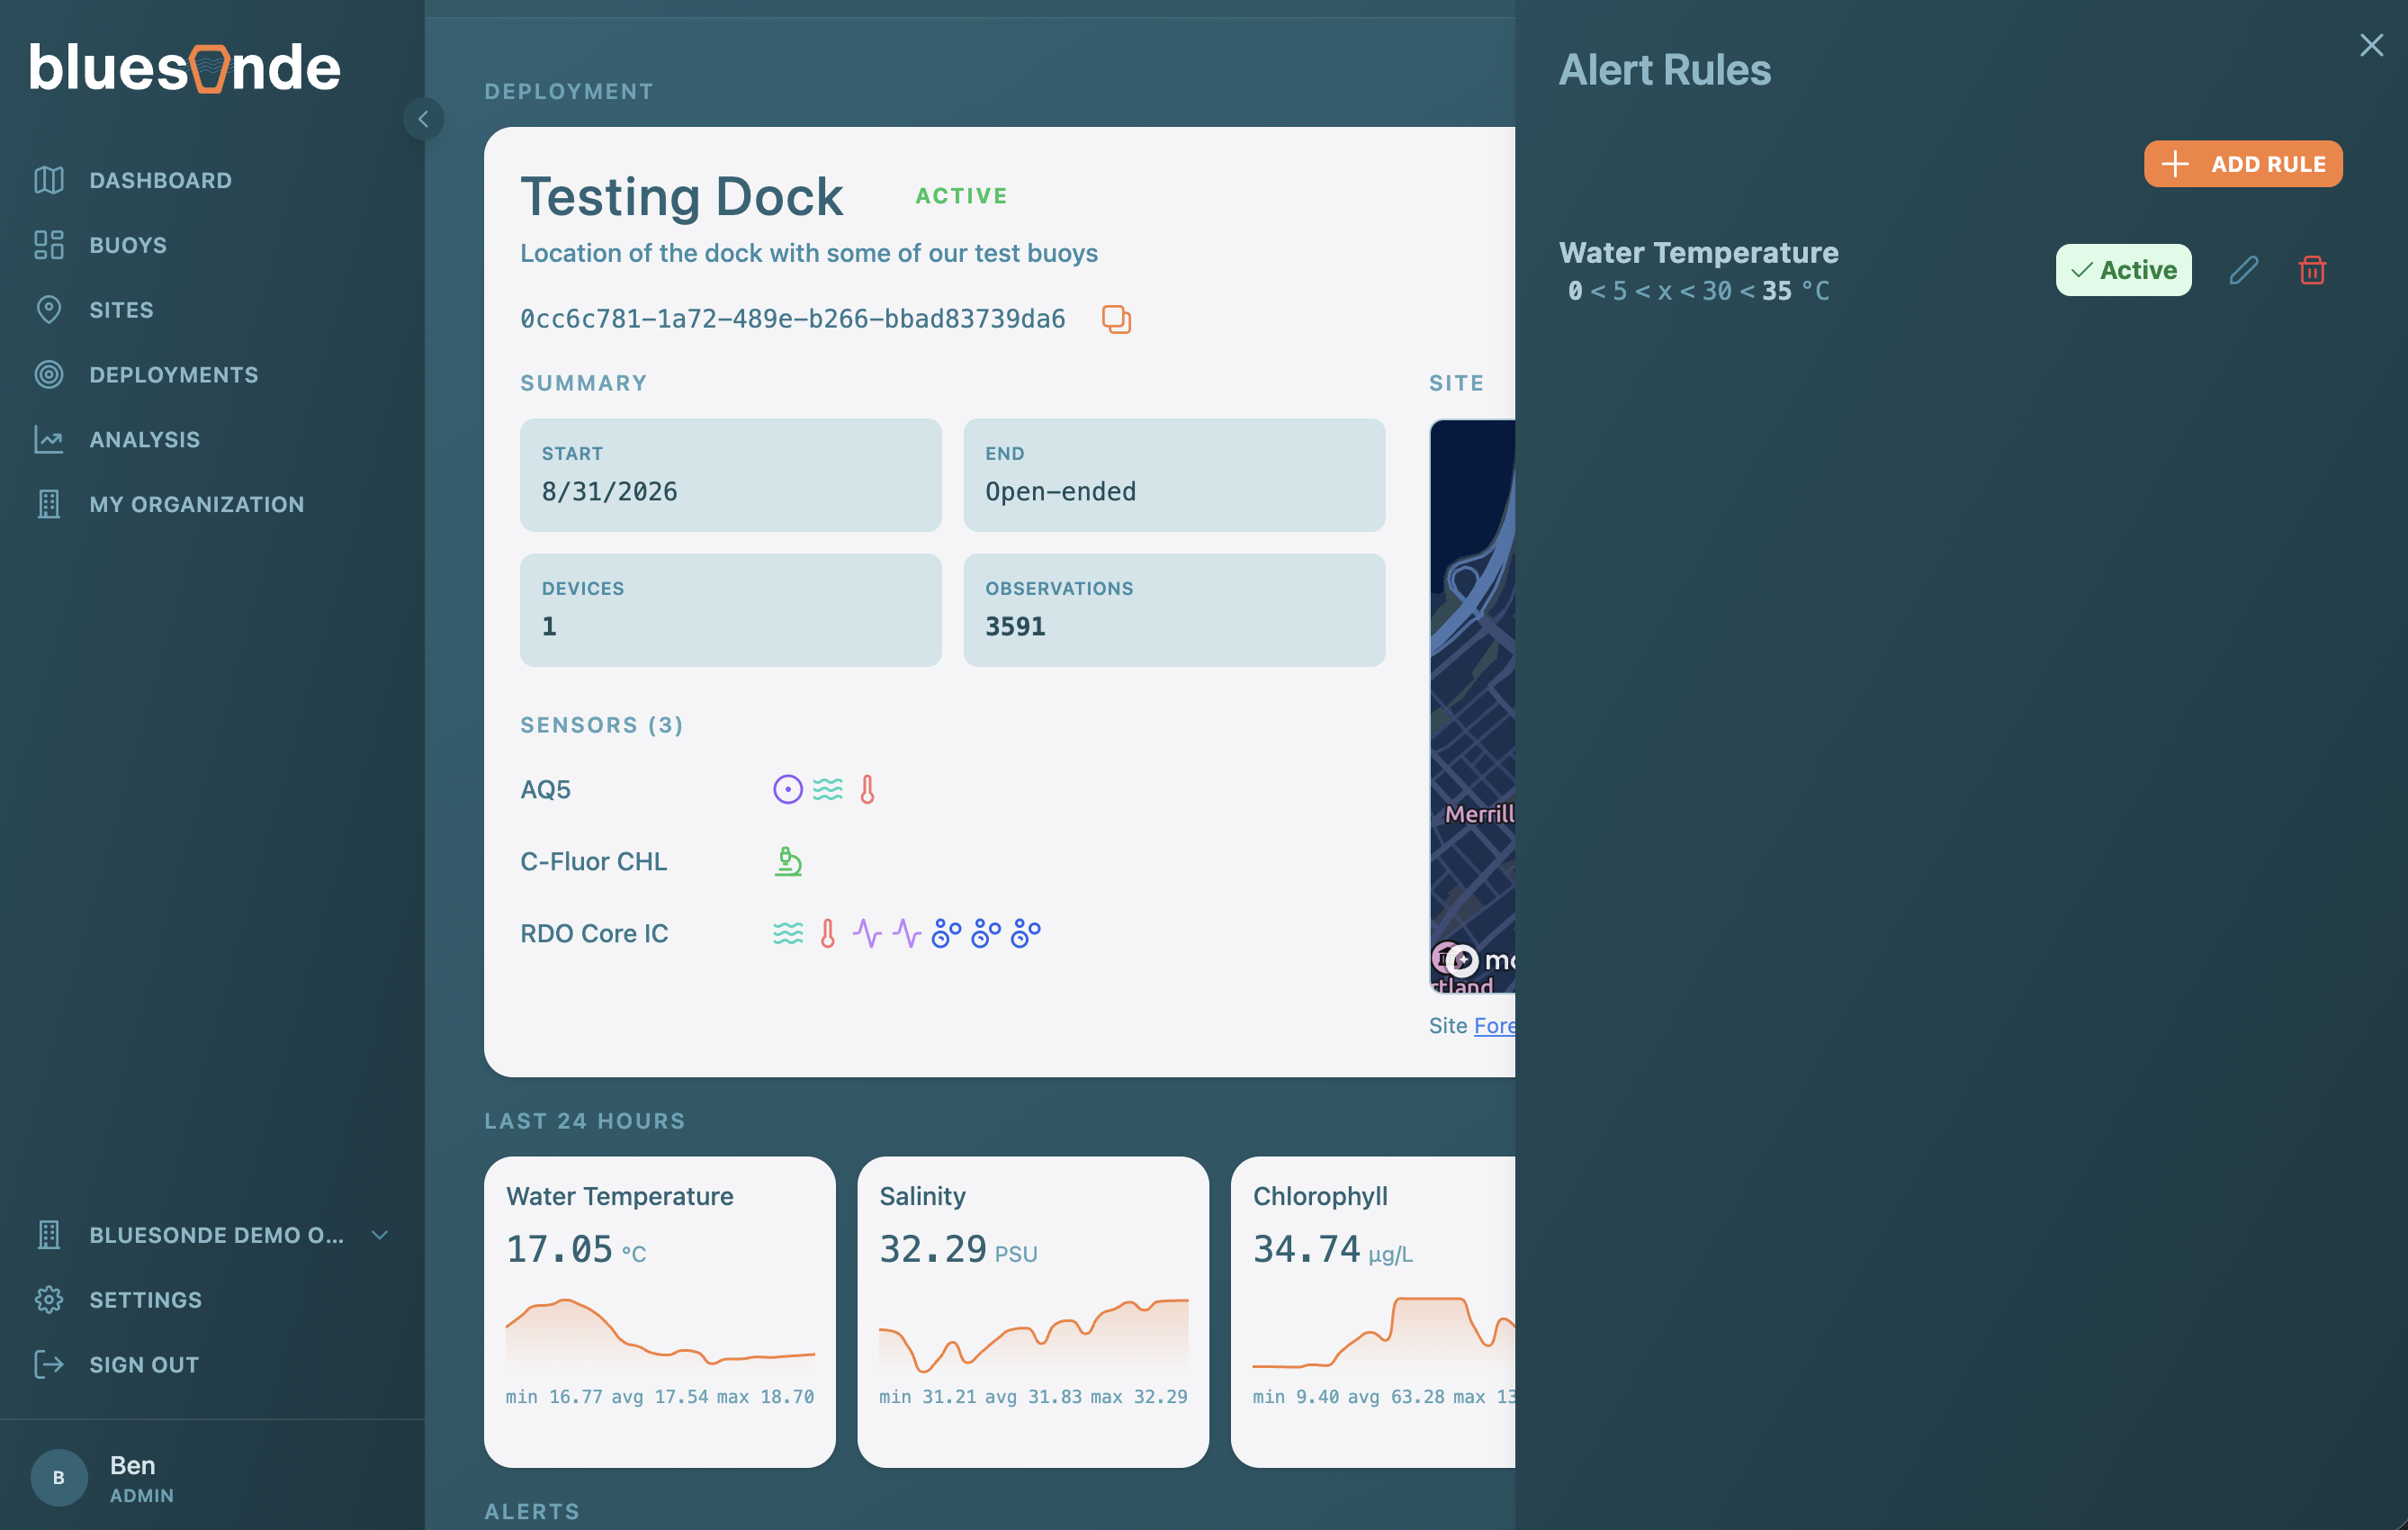
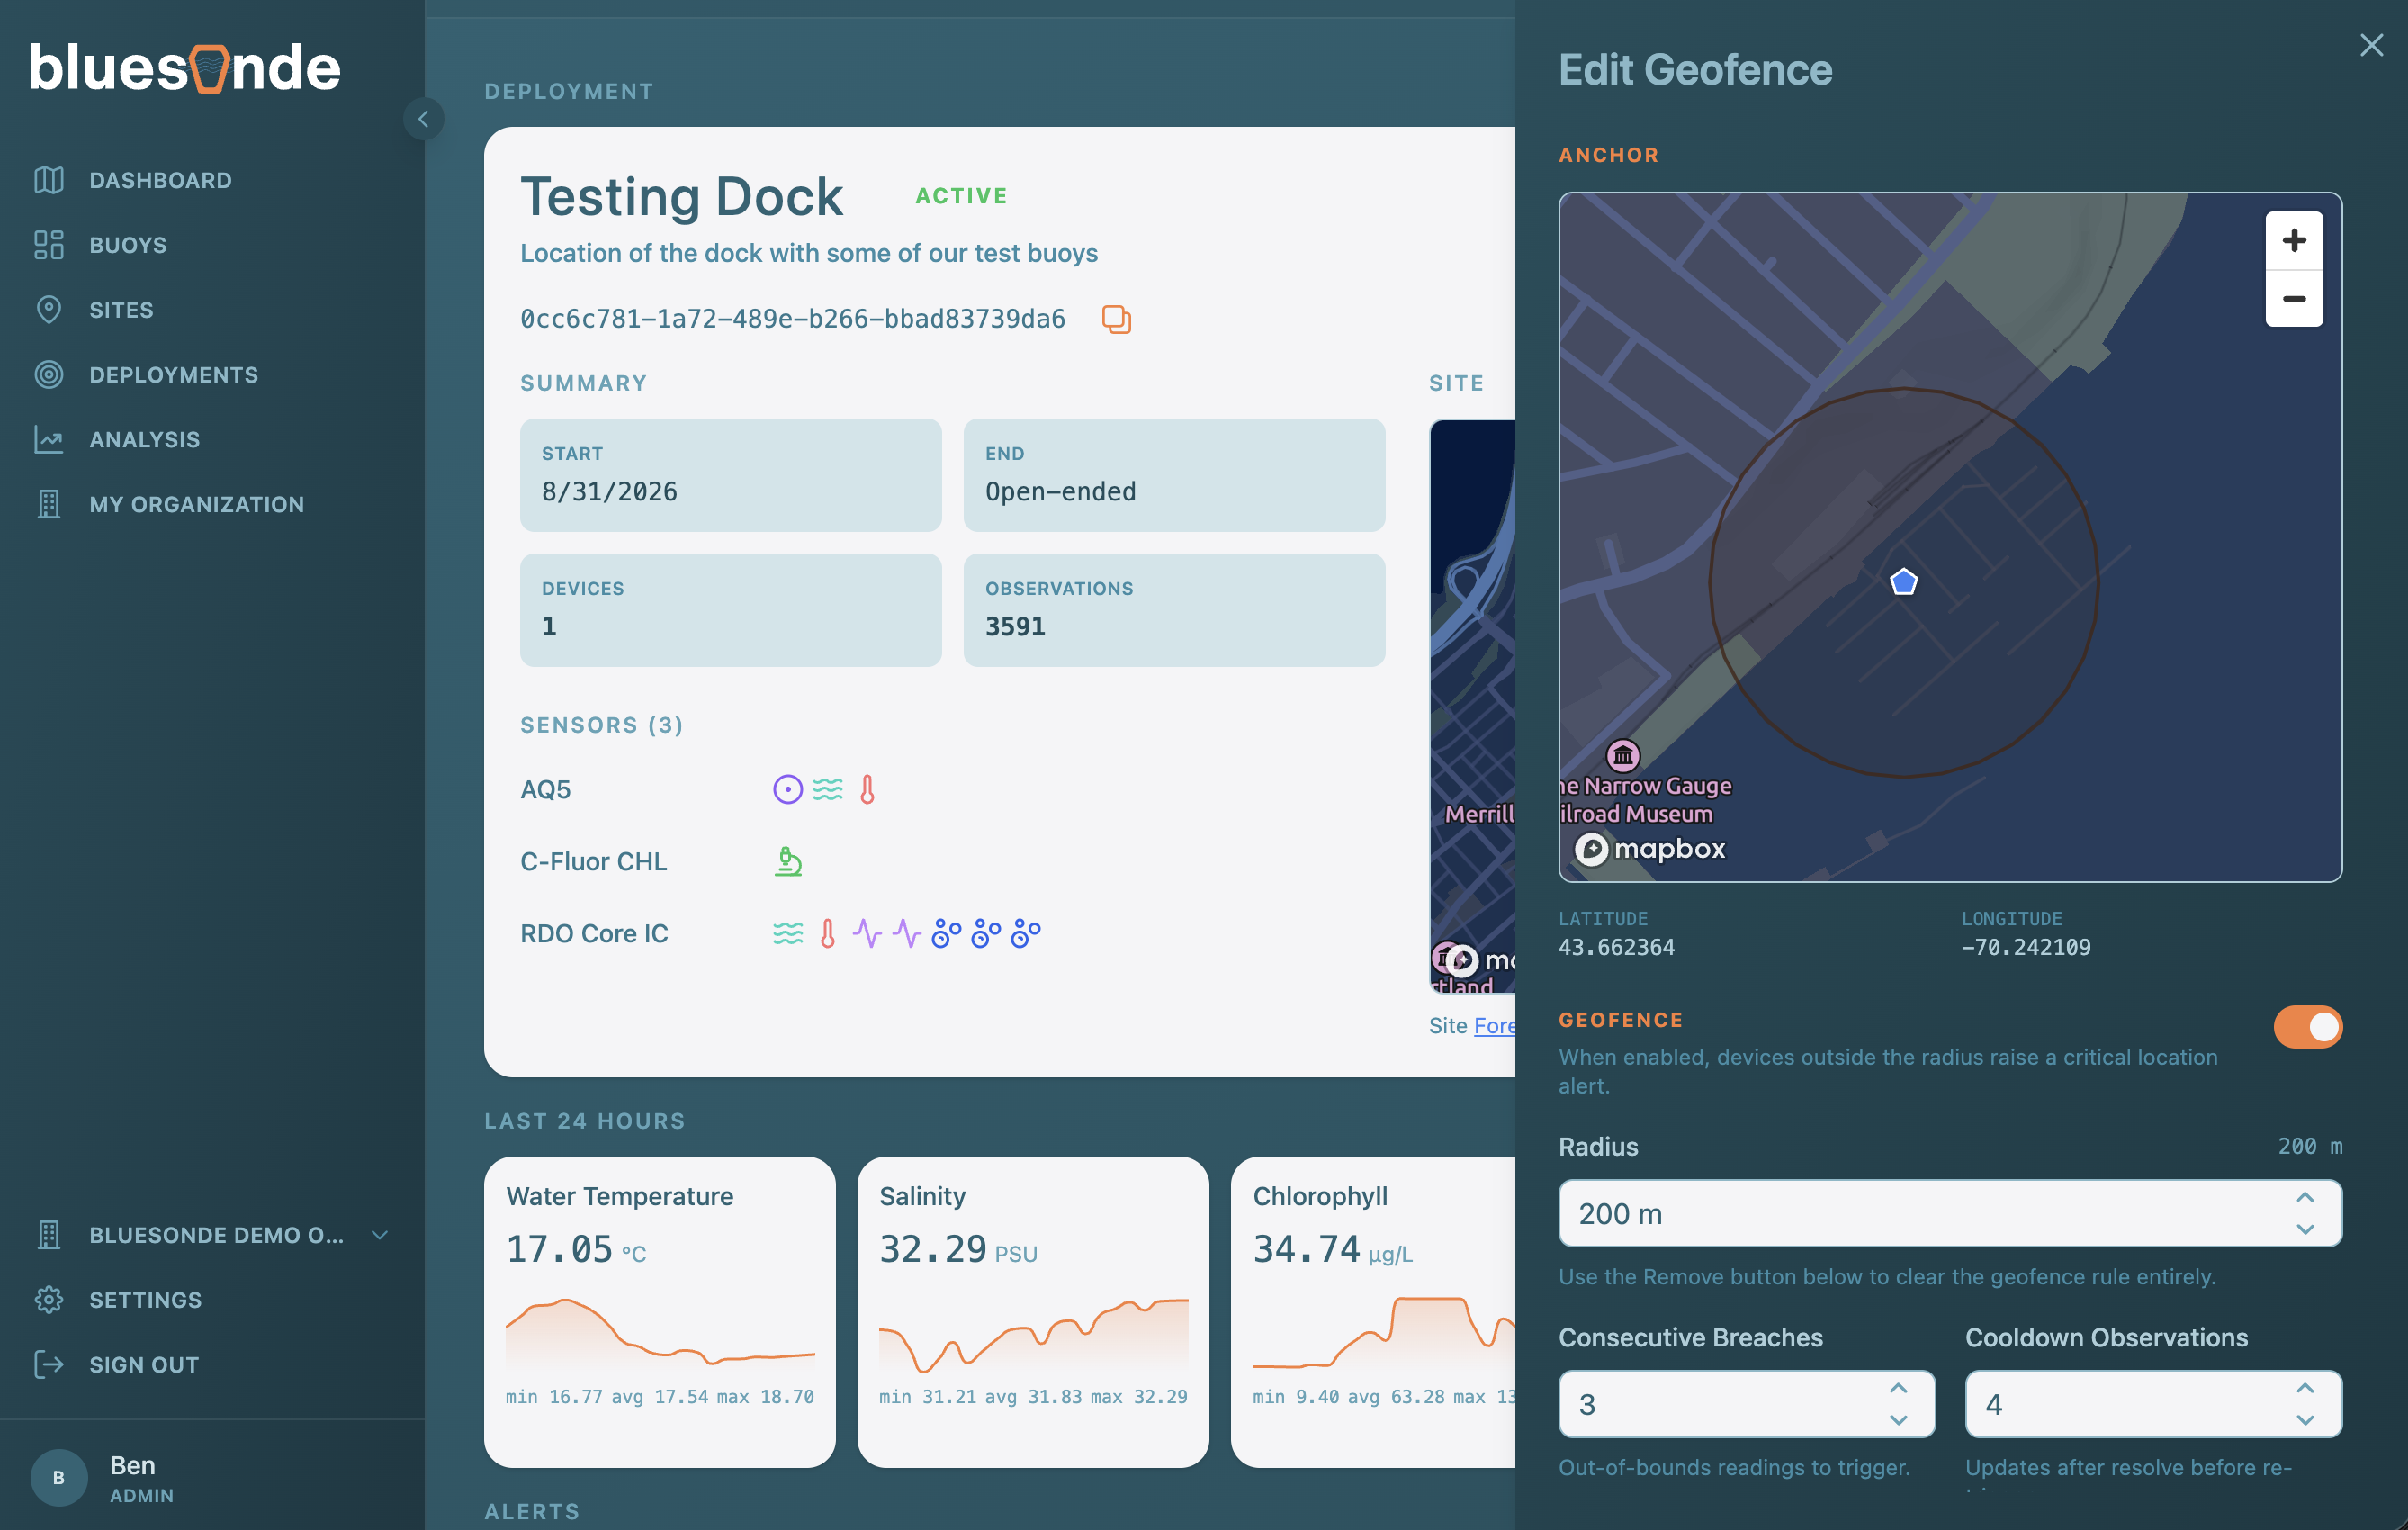
Organization Admins set up the automatic monitoring for a Deployment. An Alert Rule watches an Observed Property and raises an Alert when a reading crosses a warning or critical threshold. A Geofence raises an Alert when a Device drifts outside a set radius of the Site anchor. When an Alert fires, it appears in the Alert timeline on this page.
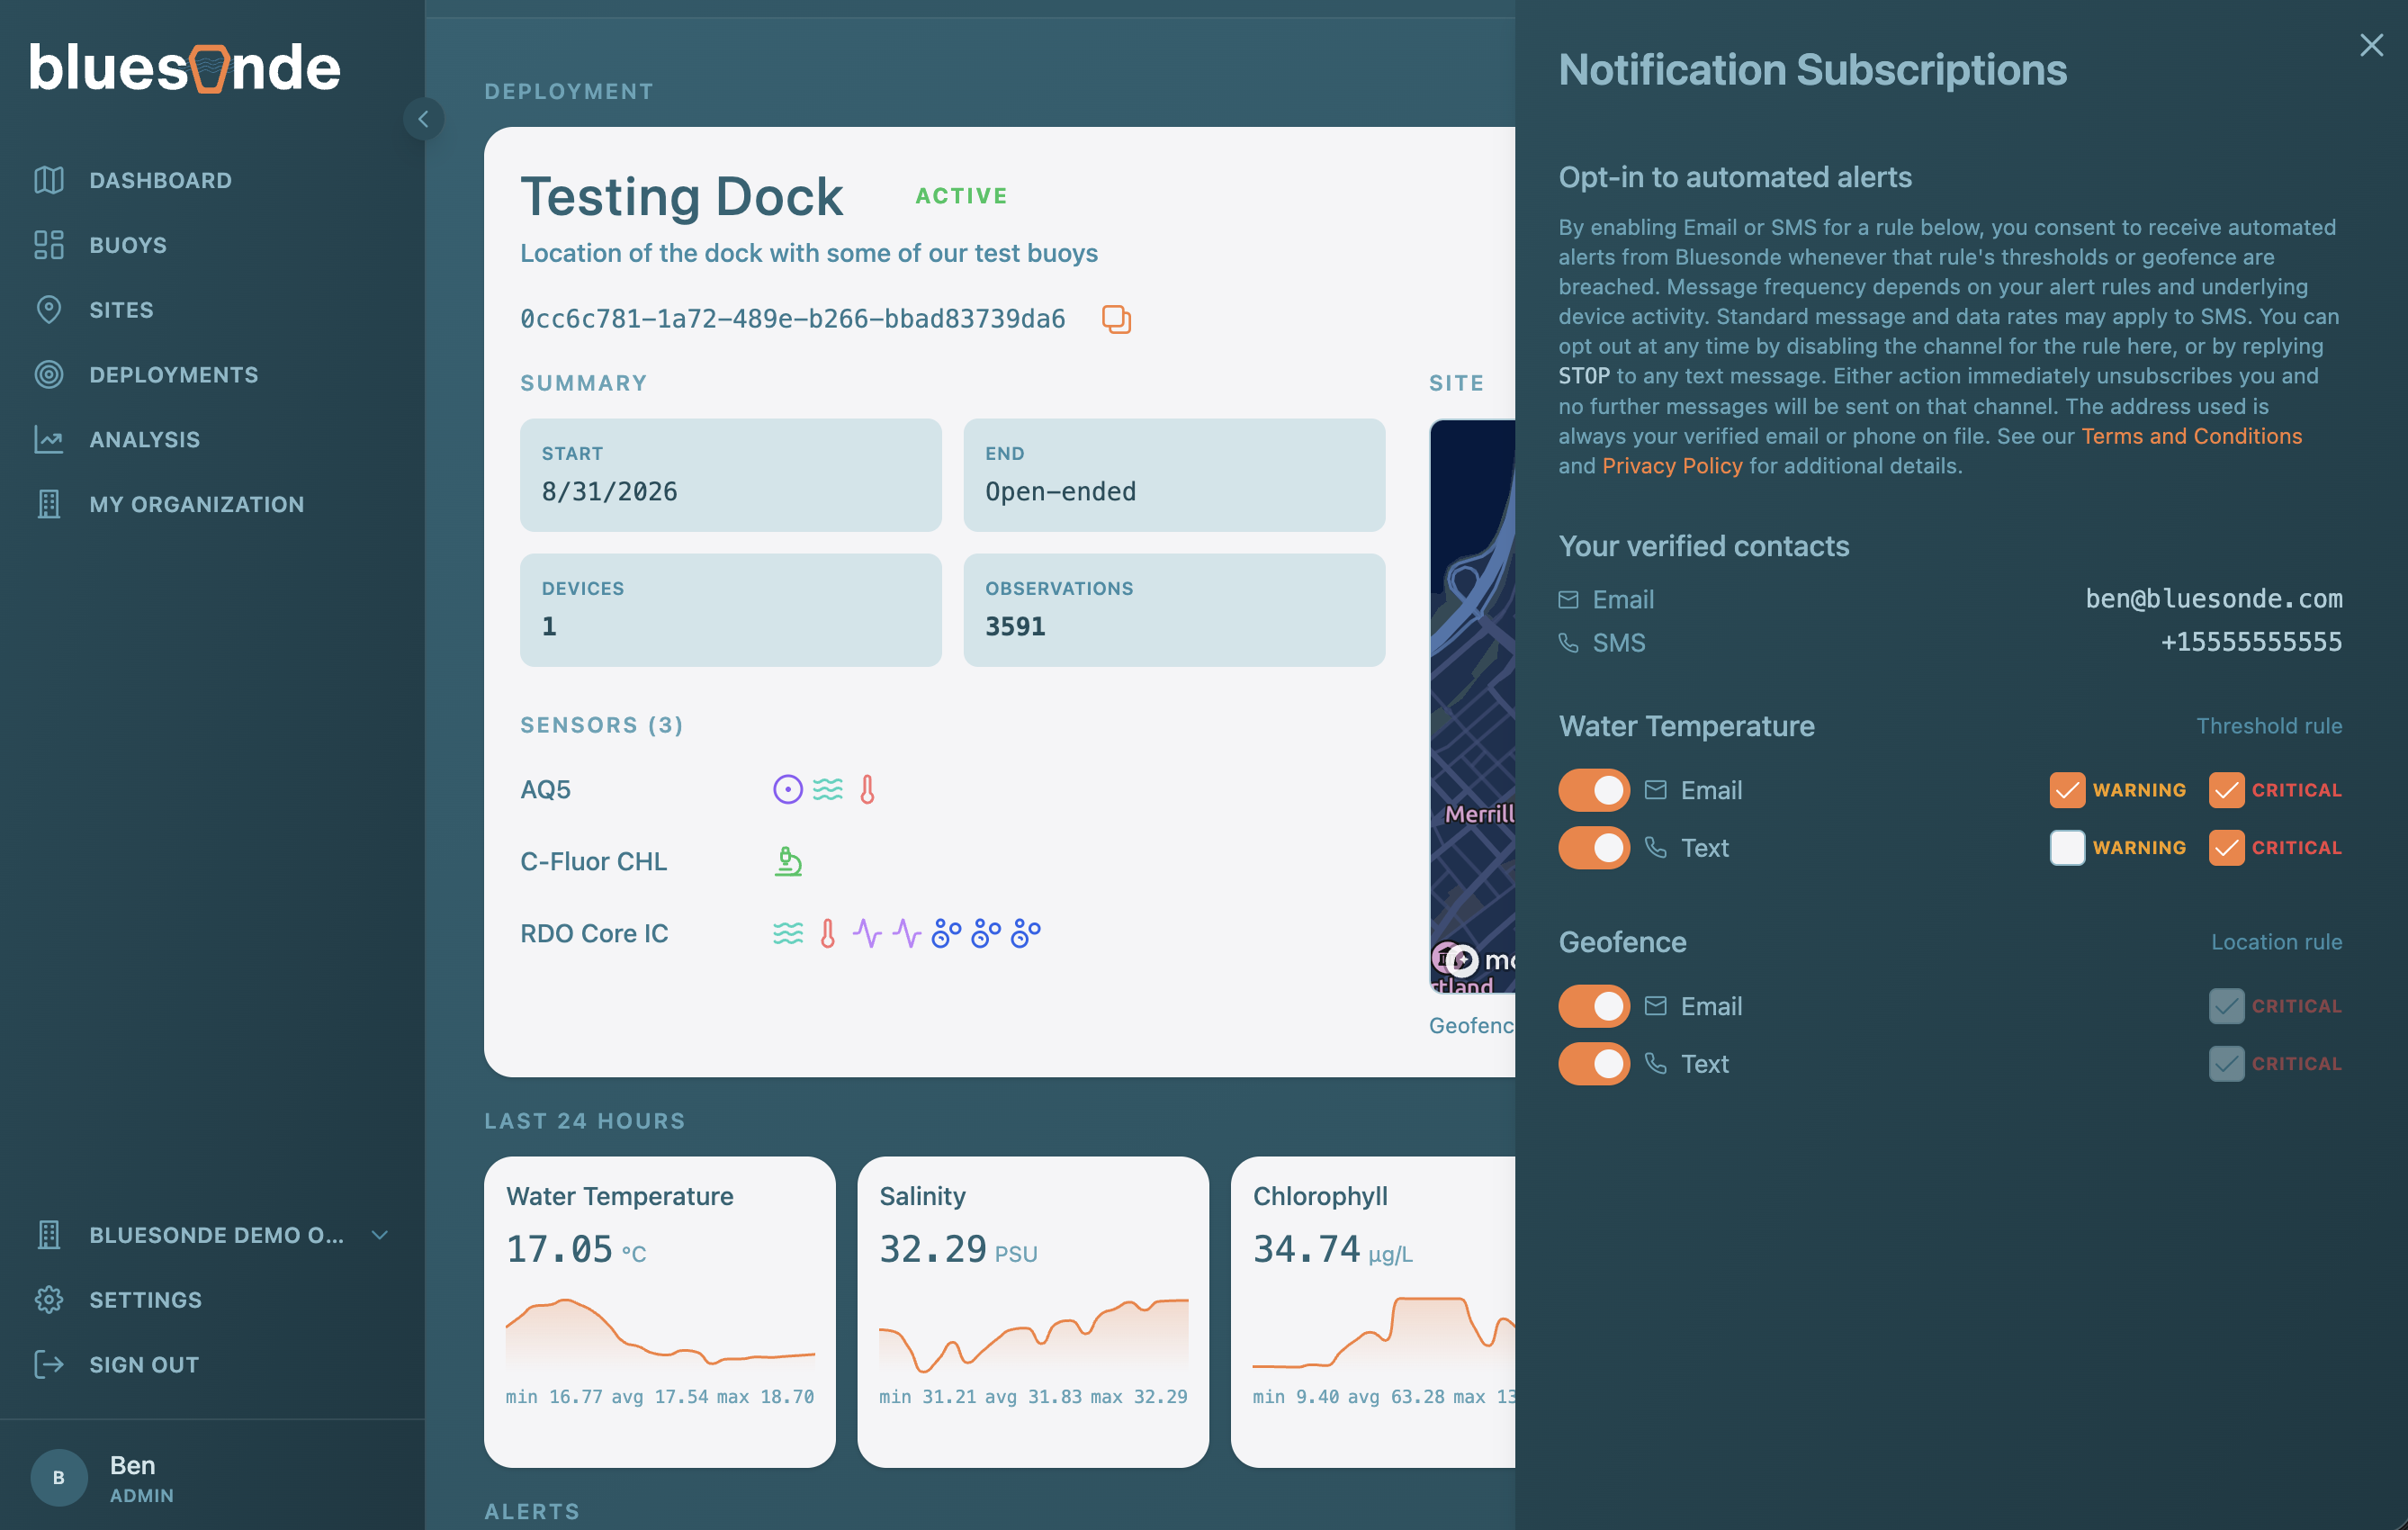
Once rules exist, any member of the Deployment can subscribe themselves to Email or SMS notifications for them using the Notification Subscription widget. Notifications are sent to the verified email and phone number on your account.
Devices and Readings
The Devices panel lists what is attached, and Admins can attach or detach Devices here. Below, you will find charts of Device readings over the Deployment window, an Observations table you can export, and, if the Deployment is anchored to a Site, charts of that Site's environmental Datastreams.
Analyzing the Data
The built-in Analysis Builder lets you plot chosen Observed Properties across the Deployment's Devices, with optional Site overlays. See the Analysis guide for how it works.